溫馨提示×
您好,登錄后才能下訂單哦!
點擊 登錄注冊 即表示同意《億速云用戶服務條款》
您好,登錄后才能下訂單哦!
這篇文章主要講解了“Python疫情數據可視化分析怎么實現”,文中的講解內容簡單清晰,易于學習與理解,下面請大家跟著小編的思路慢慢深入,一起來研究和學習“Python疫情數據可視化分析怎么實現”吧!
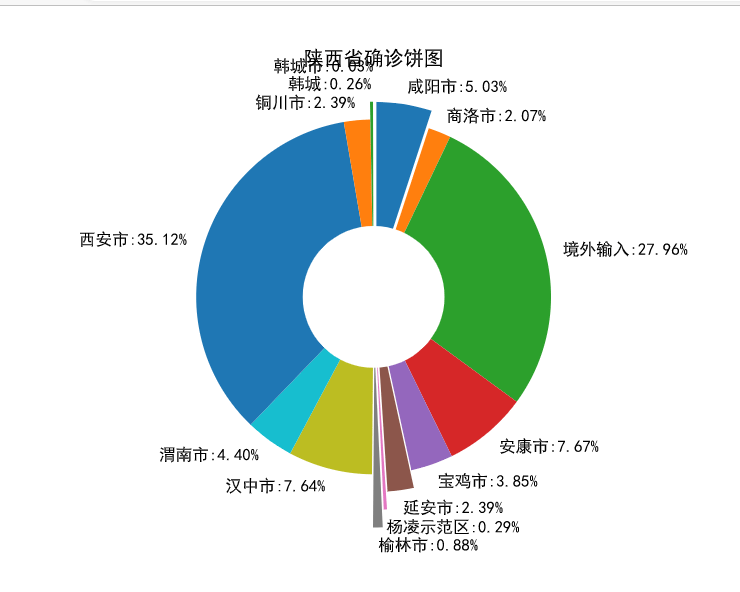
本項目主要通過python的matplotlib pandas pyecharts等庫對疫情數據進行可視化分析
數據來源:
本數據集來源于kaggle競賽的開源數據集,數據集地址
本數據集主要涉及到全球疫情統計,包括確診、治愈、死亡、時間、國家、地區等信息
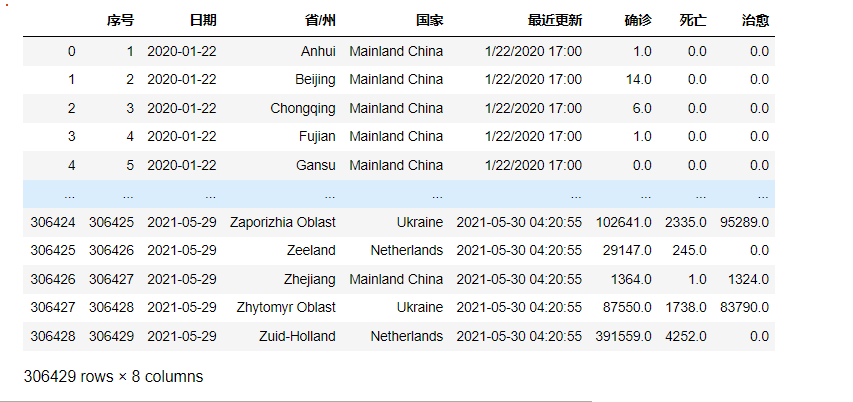
df = pd.read_csv(r'C:\Users\Hasee\Desktop/covid_19_data.csv')
df.head()

cols= ['序號','日期','省/州','國家','最近更新','確診','死亡','治愈']
df.columns = cols
df.日期 = pd.to_datetime(df.日期)
df
## 利用groupby按照日期統計確診死亡治愈病例的總和
#合并同一天同國家日期
global_confirm = df.groupby('日期')[['確診', '死亡', '治愈']].sum()
global_confirm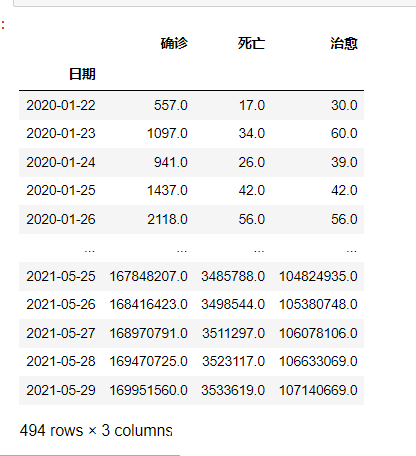
ax = global_confirm.plot(figsize = (12,10), title = '全球疫情趨勢圖')
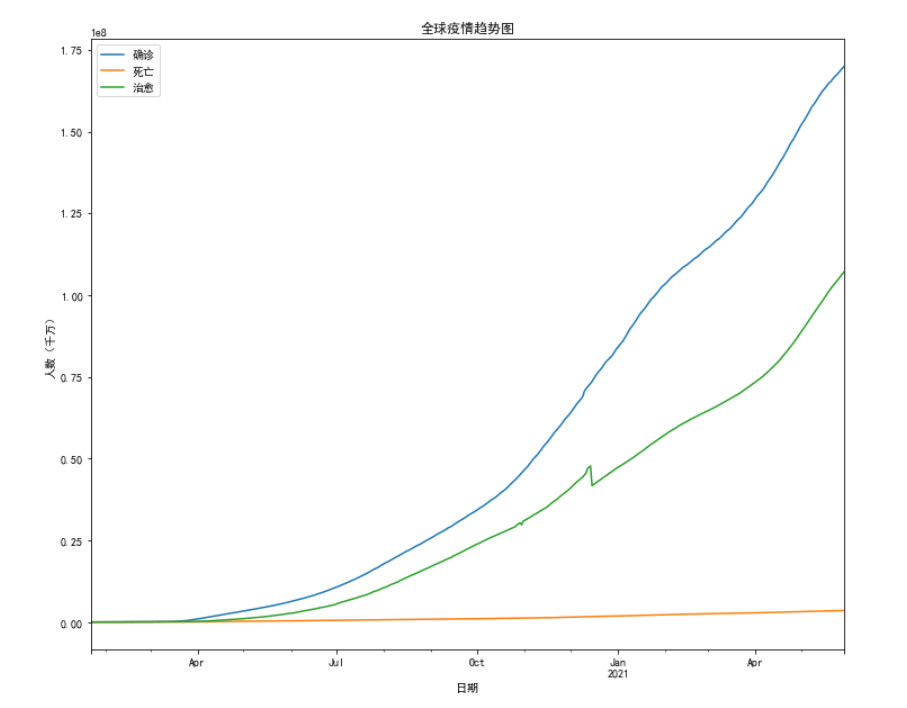
利用groupby按照日期統計確診死亡治愈病例的總和
global_china = df[df['國家'] == 'Mainland China'].reset_index()
global_china_confirm  =  global_china.groupby('日期')[['確診', '死亡', '治愈']].sum().reset_index()
畫圖,三條線組合到一個圖
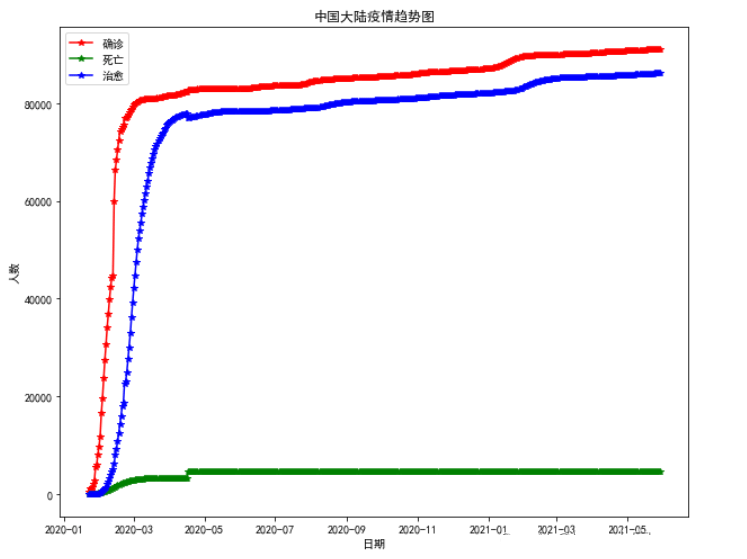
global_china = df[df['國家'] == 'Mainland China'].reset_index()
global_china_province_confirm  =  global_china.groupby('省/州')[['確診', '死亡', '治愈']].sum().reset_index()

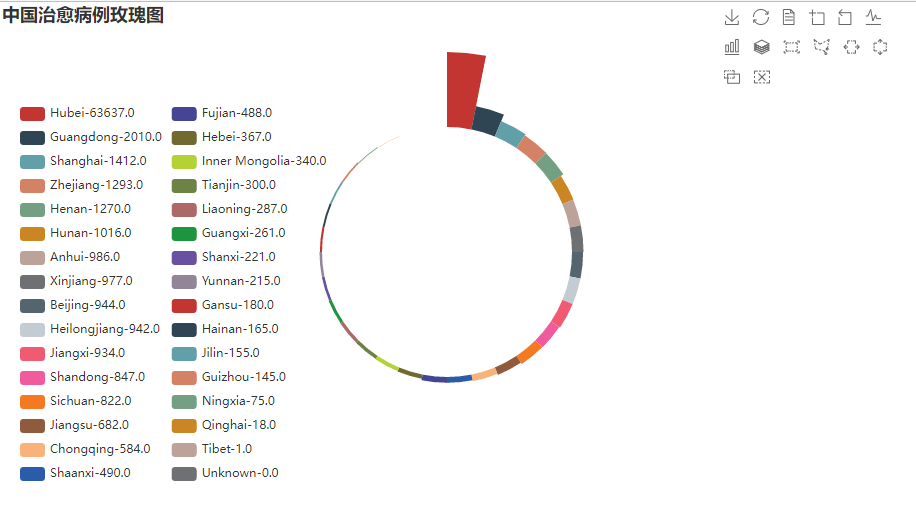
recovercent = 100.*global_china_province_confirm['治愈'] / global_china_province_confirm['治愈'].sum()
labels = ['{0}-{1:1.2f}%-{2}'.format(i,j,k) for i,j,k in zip(list(global_china_province_confirm['省/州']), recovercent, list(global_china_province_confirm['治愈']))]
plt.figure(figsize=(10,10))
plt.pie(global_china_province_confirm['治愈'],radius = 0.3)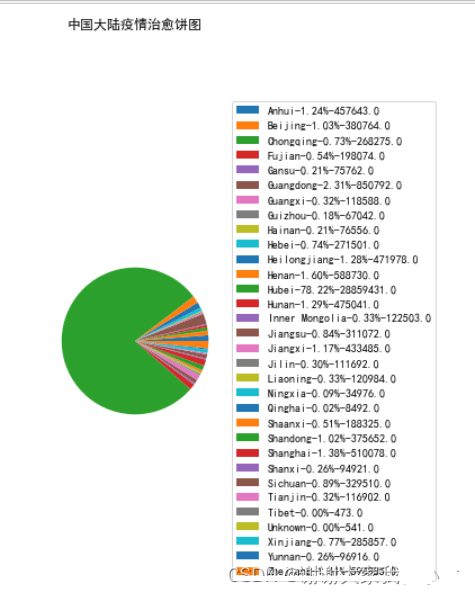
plt.figure(figsize=(16,16))
plt.barh(list(global_country_confirm_rank.國家)[::-1], list(global_country_confirm_rank.確診)[::-1])
plt.title('確診人數排名前15的國家')
plt.xlabel('人數(千萬)')
plt.ylabel('國家')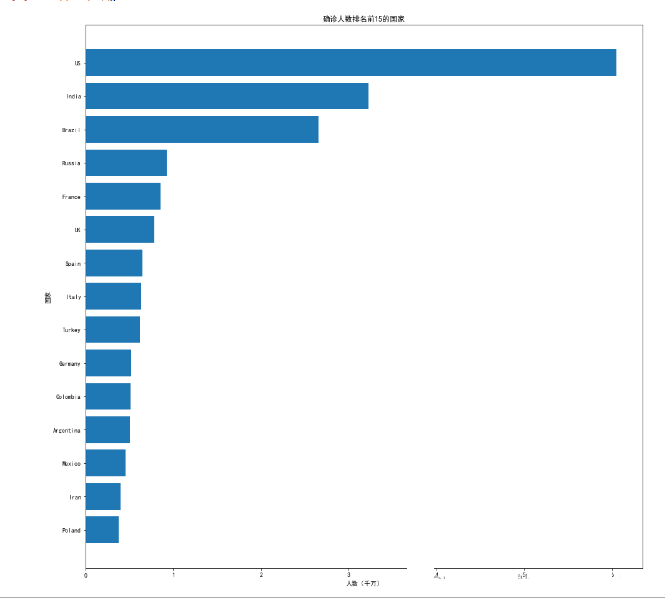
set_global_opts是設置格式:
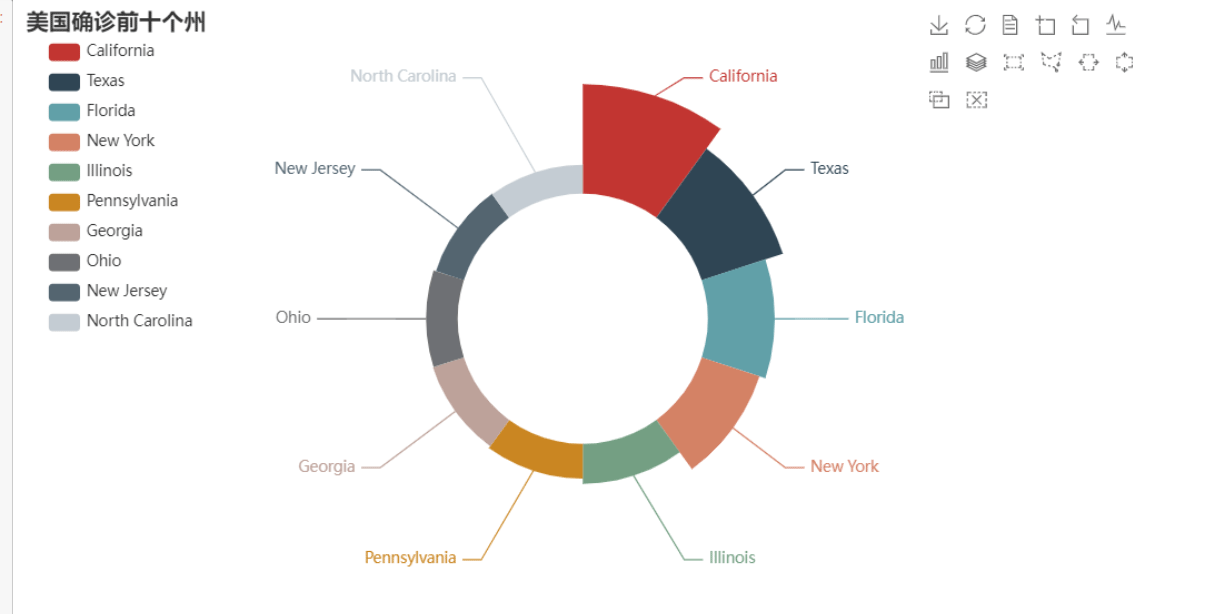
china_confirm = df[df['國家'] == "Mainland China"]
china_latest = china_confirm[china_confirm['日期'] == max(china_confirm['日期'])]

words = WordCloud()
words.add('確診人數', [tuple(dic) for dic in zip(list(china_latest['省/州']),list(china_latest['確診']))], word_size_range=[20,100])
china_death = df[df['國家'] == "Mainland China"]
china_death_latest = china_death[china_death['日期'] == max(china_death['日期'])]
china_death_latest = china_death_latest.groupby('省/州')[['確診', '死亡']].max().reset_index()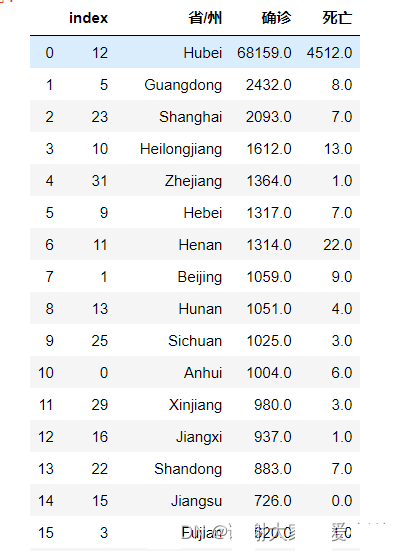
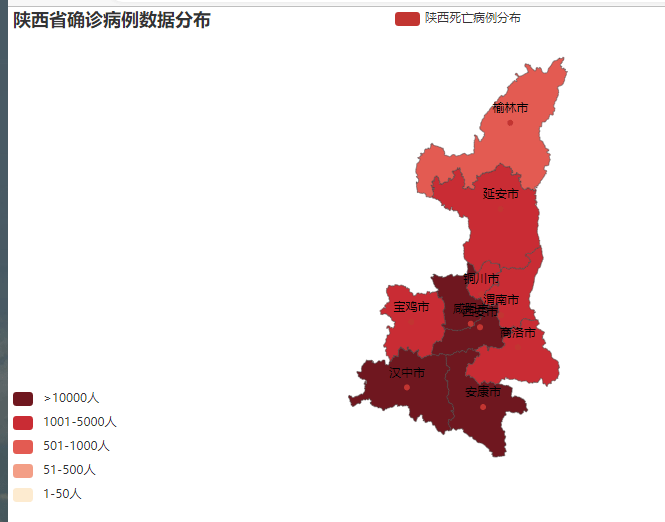
geo = Map()

geo.add("中國死亡病例分布", [list(z) for z in zip(china_death_prodic,list(china_death_latest['死亡']))], "china")
geo.set_global_opts(title_opts=opts.TitleOpts(title="全國各省死亡病例數據分布"),visualmap_opts=opts.VisualMapOpts(is_piecewise=True,
                    pieces=[
                    {"min": 1500, "label": '>10000人', "color": "#6F171F"},
                    {"min": 500, "max": 15000, "label": '500-1000人', "color": "#C92C34"},
                    {"min": 100, "max": 499, "label": '100-499人', "color": "#E35B52"},
                    {"min": 10, "max": 99, "label": '10-99人', "color": "#F39E86"},
                    {"min": 1, "max": 9, "label": '1-9人', "color": "#FDEBD0"}]))
geo.render_notebook()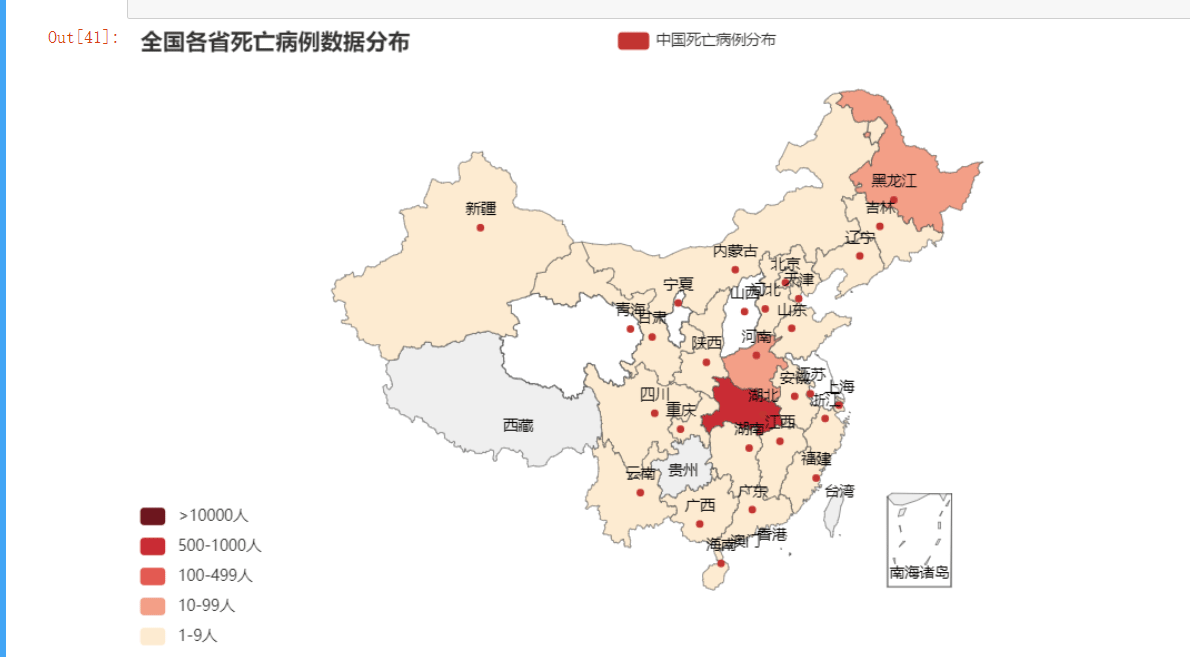
geo = Geo()
geo.add_schema(maptype="china")

geo.add("中國死亡病例分布", [list(dic) for dic in zip(china_death_prodic,list(china_death_latest['死亡']))],type_=GeoType.EFFECT_SCATTER)
geo.set_global_opts(visualmap_opts=opts.VisualMapOpts(),title_opts=opts.TitleOpts(title="全國各省死亡病例數據分布"))
geo.render_notebook()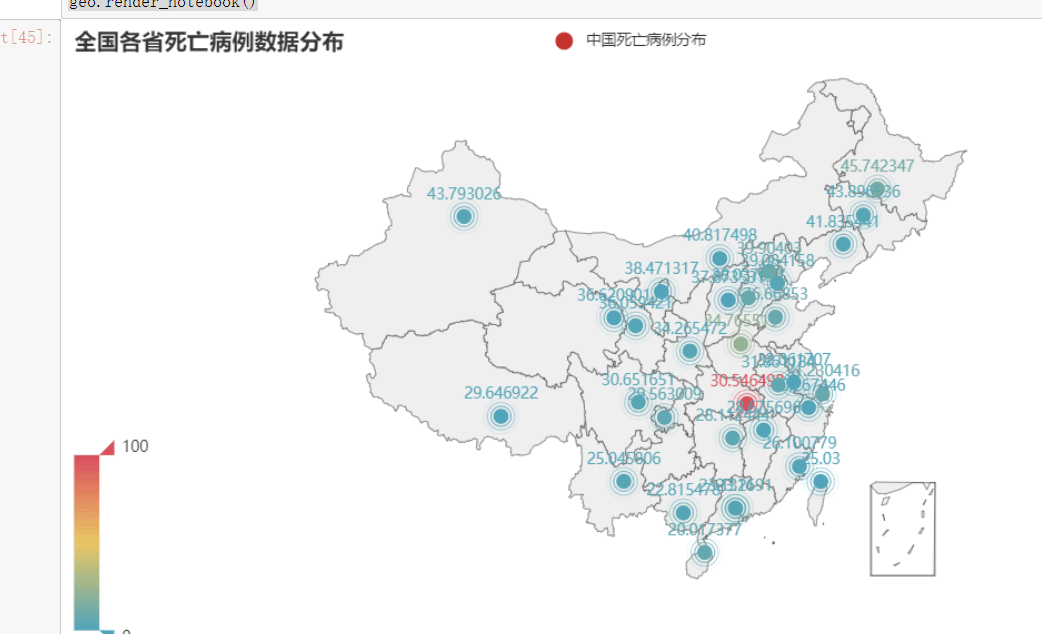
map = Map()
map.set_global_opts(title_opts=opts.TitleOpts(title="全球死亡人數地理分布情況"),visualmap_opts=opts.VisualMapOpts(is_piecewise=True,
                    pieces=[
                    {"min": 100001, "label": '>100001人', "color": "#6F171F"},
                    {"min": 10001, "max": 100000, "label": '10001-100000人', "color": "#C92C34"},
                    {"min": 1001, "max": 10000, "label": '1001-10000人', "color": "#E35B52"},
                    {"min": 101, "max": 10000, "label": '101-10000人', "color": "#F39E86"},
                    {"min": 1, "max": 100, "label": '1-100人', "color": "#FDEBD0"}]))
map.add("全球死亡人數地理分布情況", [list(z) for z in zip(global_death_n,list(global_death['死亡']))], "world")
map.set_series_opts(label_opts=opts.LabelOpts(is_show=False))
map.render_notebook()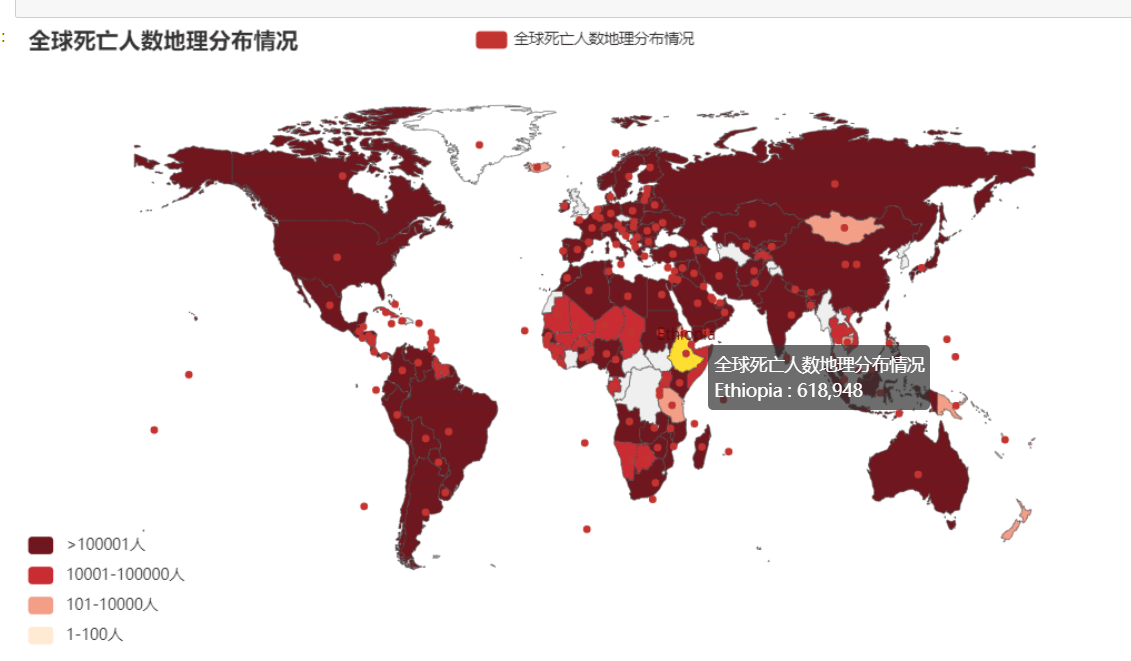
global_confirm.plot.hist(alpha=0.5)
plt.xlabel('人數(千萬)')
plt.ylabel('出現頻率')
plt.title('全球疫情頻率直方圖')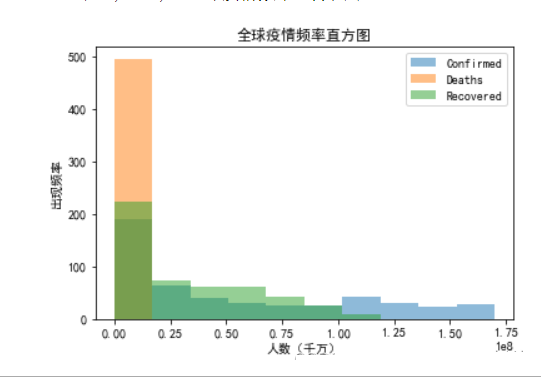
感謝各位的閱讀,以上就是“Python疫情數據可視化分析怎么實現”的內容了,經過本文的學習后,相信大家對Python疫情數據可視化分析怎么實現這一問題有了更深刻的體會,具體使用情況還需要大家實踐驗證。這里是億速云,小編將為大家推送更多相關知識點的文章,歡迎關注!
免責聲明:本站發布的內容(圖片、視頻和文字)以原創、轉載和分享為主,文章觀點不代表本網站立場,如果涉及侵權請聯系站長郵箱:is@yisu.com進行舉報,并提供相關證據,一經查實,將立刻刪除涉嫌侵權內容。