溫馨提示×
您好,登錄后才能下訂單哦!
點擊 登錄注冊 即表示同意《億速云用戶服務條款》
您好,登錄后才能下訂單哦!
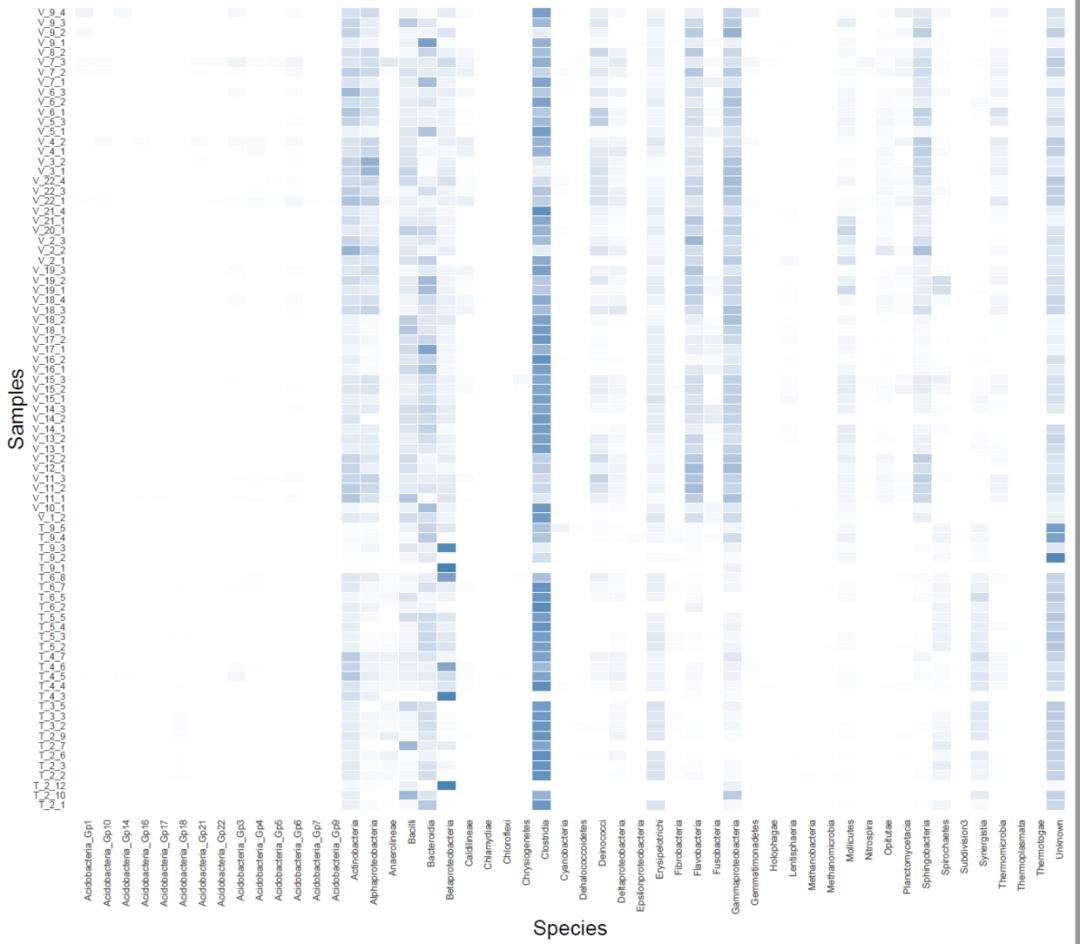
本篇文章為大家展示了R語言ggplot2兩個離散變量畫熱圖分別是怎樣的,內容簡明扼要并且容易理解,絕對能使你眼前一亮,通過這篇文章的詳細介紹希望你能有所收獲。
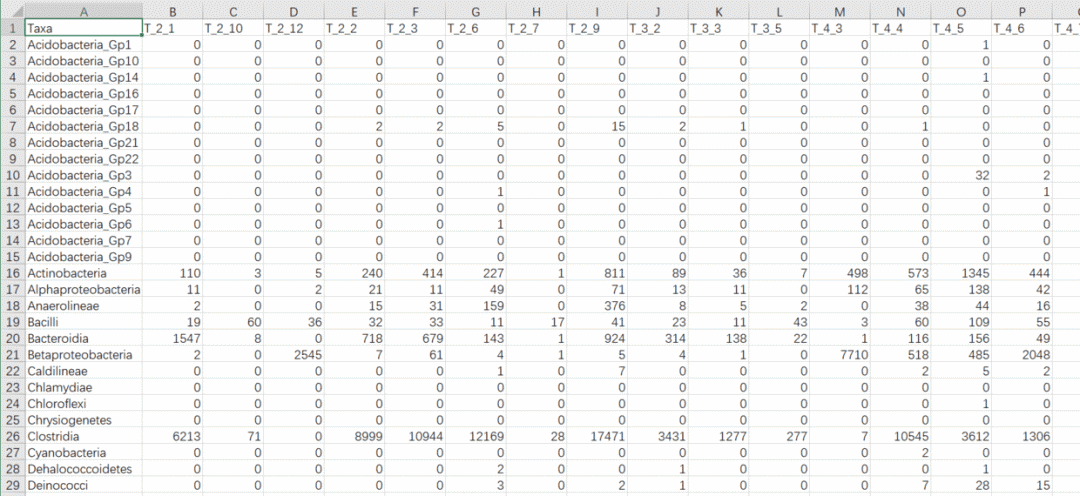
數據集的部分截圖,總共是81行,52列,行是物種,列是地點,數值代表物種豐度
數據集下載鏈接 http://userweb.eng.gla.ac.uk/umer.ijaz/bioinformatics/ecological/SPE_pitlatrine.csv
abund_table<-read.csv("pitlatrines/SPE_pitlatrine.csv",row.names=1,check.names=FALSE)
這里的參數
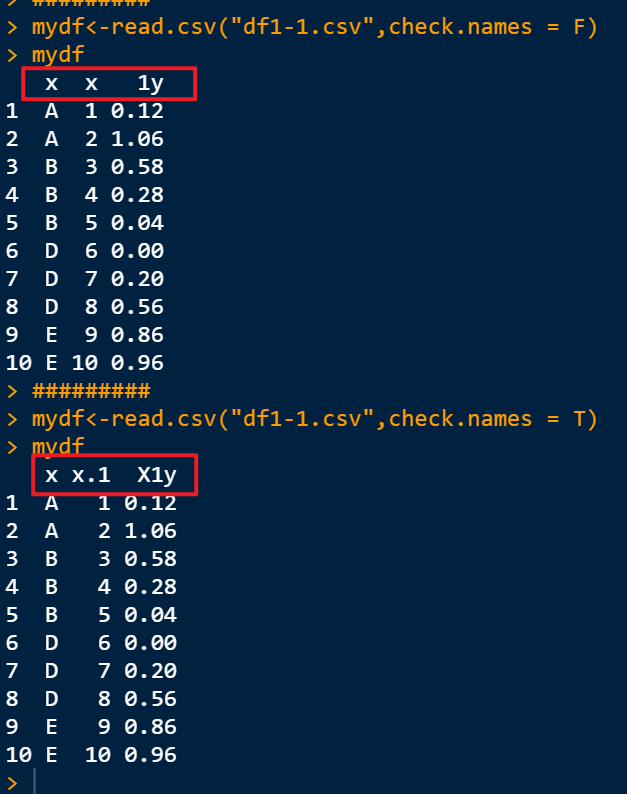
row.names=1指定第一列作為數據集的行名check.names 參數我平時很少用,,查了一下幫助文檔,作用是檢查每列的名字是否符合規范

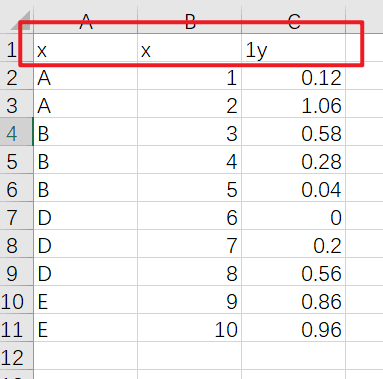
比如如下數據集 分別設置
分別設置 check.names參數為T和F大家可以看下效果
abund_table<-t(abund_table)
# Convert to relative frequencies
abund_table <- abund_table/rowSums(abund_table)
library(reshape2)
df<-melt(abund_table)
head(df)
colnames(df)<-c("Samples","Species","Value")
library(plyr)
library(scales)

# We are going to apply transformation to our data to make it
# easier on eyes

#df<-ddply(df,.(Samples),transform,rescale=scale(Value))
df<-ddply(df,.(Samples),transform,rescale=sqrt(Value))
library(ggplot2)
p <- ggplot(df, aes(Species, Samples)) +
  geom_tile(aes(fill = rescale),colour = "white") +
  scale_fill_gradient(low = "white",high = "steelblue")+
  scale_x_discrete(expand = c(0, 0)) +
  scale_y_discrete(expand = c(0, 0)) + theme(legend.position = "none",axis.ticks = element_blank(),axis.text.x = element_text(angle = 90, hjust = 1,size=5),axis.text.y = element_text(size=5))
p

上述內容就是R語言ggplot2兩個離散變量畫熱圖分別是怎樣的,你們學到知識或技能了嗎?如果還想學到更多技能或者豐富自己的知識儲備,歡迎關注億速云行業資訊頻道。
免責聲明:本站發布的內容(圖片、視頻和文字)以原創、轉載和分享為主,文章觀點不代表本網站立場,如果涉及侵權請聯系站長郵箱:is@yisu.com進行舉報,并提供相關證據,一經查實,將立刻刪除涉嫌侵權內容。