溫馨提示×
您好,登錄后才能下訂單哦!
點擊 登錄注冊 即表示同意《億速云用戶服務條款》
您好,登錄后才能下訂單哦!
這期內容當中小編將會給大家帶來有關如何設置Matplotlib繪圖屬性,文章內容豐富且以專業的角度為大家分析和敘述,閱讀完這篇文章希望大家可以有所收獲。
(1)、導入庫
import matplotlib.pyplot as plt
import numpy
(2)、figure對象和subplot簡單運用
#figure對象
fig = plt.figure()   #figure是圖象對象

ax1 = fig.add_subplot(2,2,1)  #創建一個2*2的子圖,放在第一個位置
ax2 = fig.add_subplot(2,2,2)  #創建一個2*2的子圖,放在第二個位置
ax3 = fig.add_subplot(2,2,3)  #創建一個2*2的子圖,放在第三個位置

from numpy.random import randn
plt.plot(randn(50).cumsum(),'k--')  #'k--'告訴python要畫出黑色的虛線
ax1.hist(randn(100),bins=20,color='k',alpha=0.3)

(3)、調整subplot周圍的間距
#調整subplot周圍的間距
fig,axes = plt.subplots(2,2,sharex=True,sharey=True)  #直接生成fiure對象和Axes實例(數組)
for i in range(2):
  for j in range(2):
    axes[i, j ].hist(numpy.random.randn(500),bins = 50,color='k',alpha=0.5)   #遍歷創建圖
plt.subplots_adjust(left=None,bottom=None,right=None,top=None,wspace=0,hspace=0)  #用于調整subplot周圍的間距

(4)、顏色、標記和線型
#顏色、標記和線型
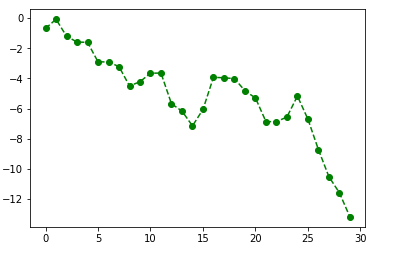
plt.figure()
##linestyle設置線型,color設置顏色,marker設置設置連接點
plt.plot(numpy.random.randn(30).cumsum(),linestyle='--',color='g',marker='o')

(5)、設置標題、軸標簽,刻度以及刻度標簽
#設置標題、軸標簽,刻度以及刻度標簽
fig = plt.figure()   #創建figure對象
ax = fig.add_subplot(1,1,1)   #獲得Axes對象
ax.plot(numpy.random.randn(1000).cumsum()) #生成隨機數
ax.set_xticks([0,250,500,750,1000])   #設置x軸刻度
ax.set_yticks([-20,-10,0,10,20])    #設置y軸刻度
ax.set_title('My first matplotlib plot')  #設置標題
ax.set_xlabel('Xtages')   #設置x軸標簽
ax.set_ylabel('Ytages')   #設置y軸標簽
(6)、添加圖例
#添加圖例
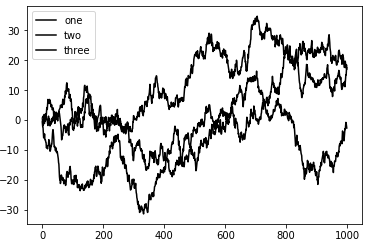
fig = plt.figure()
ax = fig.add_subplot(1,1,1)
ax.plot(numpy.random.randn(1000).cumsum(),'k',label='one') #label標簽用于添加圖例
ax.plot(numpy.random.randn(1000).cumsum(),'k',label='two')
ax.plot(numpy.random.randn(1000).cumsum(),'k',label='three')

ax.legend(loc='best')    #loc選項可以選擇圖例的位置

(7)、添加注釋
#添加注釋
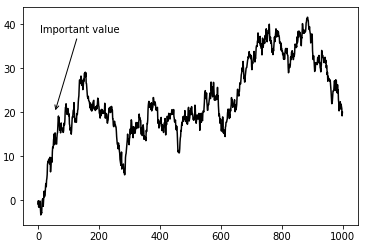
fig = plt.figure()
ax = fig.add_subplot(1,1,1)
ax.plot(numpy.random.randn(1000).cumsum(),'k',label='one') #label標簽用于添加圖例
plt.annotate("Important value", (55,20), xycoords='data',  #添加注釋的方法
     xytext=(5, 38),
     arrowprops=dict(arrowstyle='->'))
(8)、繪制常用圖形
#繪制常用圖形
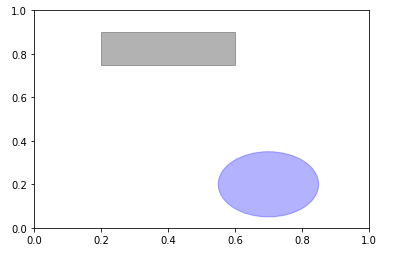
fig = plt.figure()
ax = fig.add_subplot(1,1,1)
rect = plt.Rectangle((0.2,0.75),0.4,0.15,color='k',alpha=0.3)  #長方形
circ = plt.Circle((0.7,0.2),0.15,color='b',alpha=0.3)      #橢圓形

ax.add_patch(rect)   #添加到圖版中
ax.add_patch(circ)

(9)、圖表的導出
#圖表的保存
fig = plt.figure()
ax = fig.add_subplot(1,1,1)
rect = plt.Rectangle((0.2,0.75),0.4,0.15,color='k',alpha=0.3)  #長方形
ax.add_patch(rect)   #添加到圖版中
fig.savefig('figpath.png',dpi = 400,bbox_inches='tight') #dpi可以控制圖象的分辨率,bbox_inches可以剪除圖表的空白部分
上述就是小編為大家分享的如何設置Matplotlib繪圖屬性了,如果剛好有類似的疑惑,不妨參照上述分析進行理解。如果想知道更多相關知識,歡迎關注億速云行業資訊頻道。
免責聲明:本站發布的內容(圖片、視頻和文字)以原創、轉載和分享為主,文章觀點不代表本網站立場,如果涉及侵權請聯系站長郵箱:is@yisu.com進行舉報,并提供相關證據,一經查實,將立刻刪除涉嫌侵權內容。