您好,登錄后才能下訂單哦!
您好,登錄后才能下訂單哦!
這篇文章主要介紹“Python+OpenCV怎么實現閾值分割”,在日常操作中,相信很多人在Python+OpenCV怎么實現閾值分割問題上存在疑惑,小編查閱了各式資料,整理出簡單好用的操作方法,希望對大家解答”Python+OpenCV怎么實現閾值分割”的疑惑有所幫助!接下來,請跟著小編一起來學習吧!
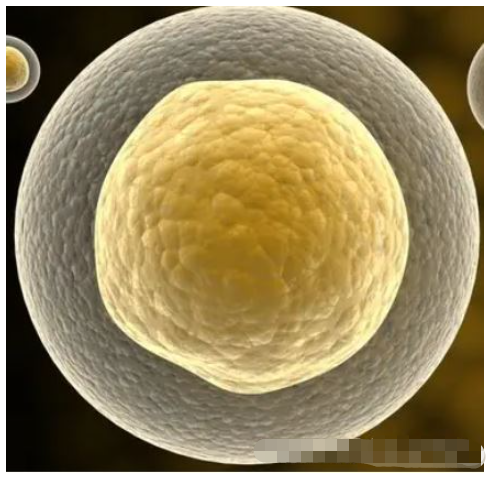
原圖:
整幅圖采用一個閾值,與圖片的每一個像素灰度進行比較,重新賦值;
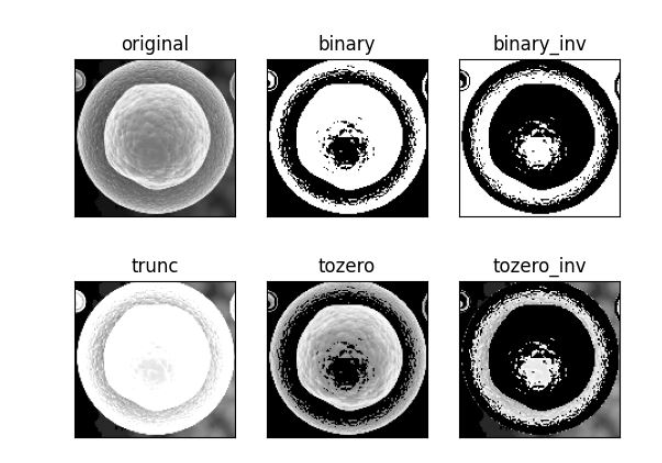
import cv2
import matplotlib.pyplot as plt
#設定閾值
thresh=130
#載入原圖,并轉化為灰度圖像
img_original=cv2.imread(r'E:\py\python3.7\test2\test14yuzhi\cell.png',0)
img_original=cv2.resize(img_original,(0,0),fx=0.3,fy=0.3)
#采用5種閾值類型(thresholding type)分割圖像
retval1,img_binary=cv2.threshold(img_original,thresh,255,cv2.THRESH_BINARY)
retval2,img_binary_invertion=cv2.threshold(img_original,thresh,255,cv2.THRESH_BINARY_INV)
retval3,img_trunc=cv2.threshold(img_original,thresh,255,cv2.THRESH_TRUNC)
retval4,img_tozero=cv2.threshold(img_original,thresh,255,cv2.THRESH_TOZERO)
retval5,img_tozero_inversion=cv2.threshold(img_original,thresh,255,cv2.THRESH_TOZERO_INV)
#采用plt.imshow()顯示圖像
imgs=[img_original,img_binary,img_binary_invertion,img_trunc,img_tozero,img_tozero_inversion]
titles=['original','binary','binary_inv','trunc','tozero','tozero_inv']
for i in range(6):
    plt.subplot(2,3,i+1)
    plt.imshow(imgs[i],'gray')
    plt.title(titles[i])
    plt.xticks([])
    plt.yticks([])
plt.show()
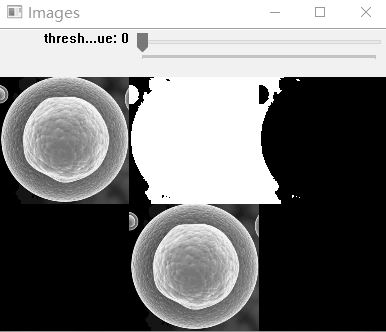
代碼如下(示例):
import cv2
import numpy as np
import matplotlib.pyplot as plt
#載入原圖,轉化為灰度圖像,并通過cv2.resize()等比調整圖像大小
img_original=cv2.imread(r'E:\py\python3.7\test2\test14yuzhi\cell.png',0)
img_original=cv2.resize(img_original,(0,0),fx=0.3,fy=0.3)
#初始化閾值,定義全局變量imgs
thresh=130
imgs=0
#創建滑動條回調函數,參數thresh為滑動條對應位置的數值
def threshold_segmentation(thresh):
    #采用5種閾值類型(thresholding type)分割圖像
    retval1,img_binary=cv2.threshold(img_original,thresh,255,cv2.THRESH_BINARY)
    retval2,img_binary_invertion=cv2.threshold(img_original,thresh,255,cv2.THRESH_BINARY_INV)
    retval3,img_trunc=cv2.threshold(img_original,thresh,255,cv2.THRESH_TRUNC)
    retval4,img_tozero=cv2.threshold(img_original,thresh,255,cv2.THRESH_TOZERO)
    retval5,img_tozero_inversion=cv2.threshold(img_original,thresh,255,cv2.THRESH_TOZERO_INV)
    #由于cv2.imshow()顯示的是多維數組(ndarray),因此我們通過np.hstack(數組水平拼接)
    #和np.vstack(豎直拼接)拼接數組,達到同時顯示多幅圖的目的
    img1=np.hstack([img_original,img_binary,img_binary_invertion])
    img2=np.hstack([img_trunc,img_tozero,img_tozero_inversion])
    global imgs
    imgs=np.vstack([img1,img2])
#新建窗口
cv2.namedWindow('Images')
#新建滑動條,初始位置為130
cv2.createTrackbar('threshold value','Images',130,255,threshold_segmentation)
#第一次調用函數
threshold_segmentation(thresh)
#顯示圖像
while(1):
    cv2.imshow('Images',imgs)
    if cv2.waitKey(1)==ord('q'):
        break
cv2.destroyAllWindows()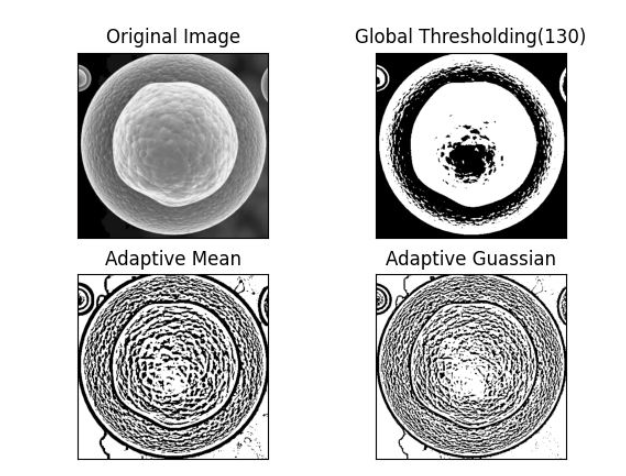
代碼如下(示例):
import cv2
import matplotlib.pyplot as plt
#載入原圖
img_original=cv2.imread(r'E:\py\python3.7\test2\test14yuzhi\cell.png',0)
#全局閾值分割
retval,img_global=cv2.threshold(img_original,130,255,cv2.THRESH_BINARY)
#自適應閾值分割
img_ada_mean=cv2.adaptiveThreshold(img_original,255,cv2.ADAPTIVE_THRESH_MEAN_C,cv2.THRESH_BINARY,15,3)
img_ada_gaussian=cv2.adaptiveThreshold(img_original,255,cv2.ADAPTIVE_THRESH_GAUSSIAN_C,cv2.THRESH_BINARY,15,3)
imgs=[img_original,img_global,img_ada_mean,img_ada_gaussian]
titles=['Original Image','Global Thresholding(130)','Adaptive Mean','Adaptive Guassian',]
#顯示圖片
for i in range(4):
    plt.subplot(2,2,i+1)
    plt.imshow(imgs[i],'gray')
    plt.title(titles[i])
    plt.xticks([])
    plt.yticks([])
plt.show()
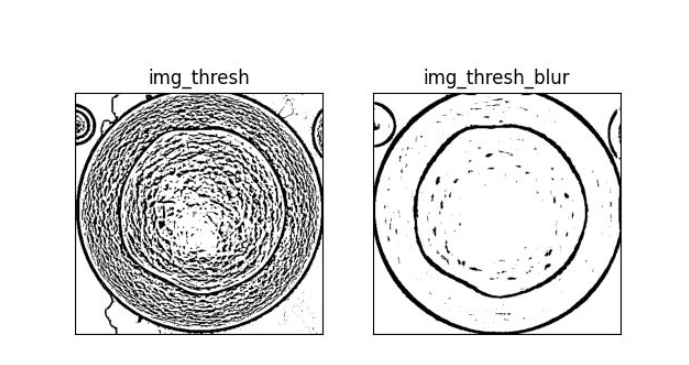
代碼如下(示例):
import cv2
import matplotlib.pyplot as plt
#載入原圖
img_original=cv2.imread(r'E:\py\python3.7\test2\test14yuzhi\cell.png',0)
#高斯濾波
img_blur=cv2.GaussianBlur(img_original,(13,13),13)  #根據情況修改參數
#自適應閾值分割
img_thresh=cv2.adaptiveThreshold(img_original,255,cv2.ADAPTIVE_THRESH_GAUSSIAN_C,cv2.THRESH_BINARY,15,3)
img_thresh_blur=cv2.adaptiveThreshold(img_blur,255,cv2.ADAPTIVE_THRESH_GAUSSIAN_C,cv2.THRESH_BINARY,15,3)
#顯示圖像
imgs=[img_thresh,img_thresh_blur]
titles=['img_thresh','img_thresh_blur']
for i in range(2):
    plt.subplot(1,2,i+1)
    plt.imshow(imgs[i],'gray')
    plt.title(titles[i])
    plt.xticks([])
    plt.yticks([])
plt.show()
1.cv2.threshold(src, thresh, maxval, type)
參數:
src:輸入的圖像
thresh:圖像分割所用的閾值(threshold value)
maxval:當閾值類型(thresholding type)采用cv2.THRESH_BINARY和cv2.THRESH_BINARY_INV時像素點被賦予的新值
type:介紹6種類型:
cv2.THRESH_BINARY(當圖像某點像素值大于thresh(閾值)時賦予maxval,反之為0。注:最常用)
cv2.THRESH_BINARY_INV(當圖像某點像素值小于thresh時賦予maxval,反之為0)
cv2.THRESH_TRUNC(當圖像某點像素值大于thresh時賦予thresh,反之不變。注:雖然maxval沒用了,但是調用函數不能省略)
cv2.THRESH_TOZERO(當圖像某點像素值小于thresh時賦予0,反之不變。注:同上)
cv2.THRESH_TOZERO_INV(當圖像某點像素值大于thresh時賦予0,反之不變。注:同上)
cv2.THRESH_OTSU(該方法自動尋找最優閾值,并返回給retval,見下文)
返回值:
retval:設定的thresh值,或者是通過cv2.THRESH_OTSU算出的最優閾值
dst:閾值分割后的圖像
到此,關于“Python+OpenCV怎么實現閾值分割”的學習就結束了,希望能夠解決大家的疑惑。理論與實踐的搭配能更好的幫助大家學習,快去試試吧!若想繼續學習更多相關知識,請繼續關注億速云網站,小編會繼續努力為大家帶來更多實用的文章!
免責聲明:本站發布的內容(圖片、視頻和文字)以原創、轉載和分享為主,文章觀點不代表本網站立場,如果涉及侵權請聯系站長郵箱:is@yisu.com進行舉報,并提供相關證據,一經查實,將立刻刪除涉嫌侵權內容。