溫馨提示×
您好,登錄后才能下訂單哦!
點擊 登錄注冊 即表示同意《億速云用戶服務條款》
您好,登錄后才能下訂單哦!
本文小編為大家詳細介紹“vue+antv怎么實現折線圖”,內容詳細,步驟清晰,細節處理妥當,希望這篇“vue+antv怎么實現折線圖”文章能幫助大家解決疑惑,下面跟著小編的思路慢慢深入,一起來學習新知識吧。
之前使用的圖表是echarts+highcharts兩個常用圖表的,現在的話因為項目需要和別的原因也接觸使用了阿里的g2圖表,感覺效果還是挺好的,在這里分享下
官網入口

第一:安裝插件
npm install @antv/g2 --save
第二:lineCharts.vue,注意,圖表這類型的數據必須mouned賦值一次,watch監聽到數據改變在賦值一次,因為這里綁定的數據傳過來后并不會同時加載圖表
<template>
  <div class="gcharts" :id="id"></div>
</template>
<script>
import G2 from '@antv/g2'
export default {
  data () {
    return {
      chart: null
    }
  },
  props: {
    charData: {
      type: Array,
      default: function () {
        return {
          data: []
        }
      }
    },
    id: String
  },
  // 如果使用serverData傳過來的靜態數據 請使用mounted()方法 并注釋掉watch
  mounted () {
    this.drawChart()
  },
  // 監聽API接口傳過來的數據 使用watch
  // watch: {
      // charData: function (val, oldVal) {    // 監聽charData,當發生變化時,觸發這個回調函數繪制圖表
      // console.log('new: %s, old: %s', val, oldVal);
      // this.drawChart(val);
    // }
  methods: {
    drawChart() {
      // 2019.03.30 更新 destory方法已被廢棄
      // this.chart && this.chart.destory()
      this.chart = new G2.Chart({
        container: this.id,
        width: 1550,
        height: 425
      })
      this.chart.source(this.charData)
      this.chart.scale('value', {
        min: 0
      })
      this.chart.scale('year', {
        range: [0, 1]
      })
      this.chart.tooltip({
        crosshairs: {
          type: 'line'
        }
      })
      this.chart.line().position('year*value')
      this.chart.point().position('year*value').size(4).shape('circle').style({
        stroke: '#fff',
        lineWidth: 1
      })
      this.chart.render()
    }
  }
}
</script>
<style lang='less' scope>
.gcharts{
width:100%;
height:100%;
}
</style>第三:調用部分
<lineCharts :charData="lineData" :id="'chart1'"></lineCharts>
import lineCharts from '@/components/gcharts/lineCharts'//g2繪圖
components: {
    lineCharts,
  },


data () {
    return {
        lineData:[
                {year: '10/20',
                  value: 30
                }, {
                  year: '10/21',
                  value: 40
                }, {
                  year: '10/22',
                  value: 30.5
                }, {
                  year: '10/23',
                  value: 50
                }, {
                  year: '10/24',
                  value: 40.9
                }, {
                  year: '10/25',
                  value: 60
                }, {
                  year: '10/26',
                  value: 70
                }, {
                  year: '10/27',
                  value: 90
                }, {
                  year: '10/28',
                  value: 63
                }]


}}
data: [
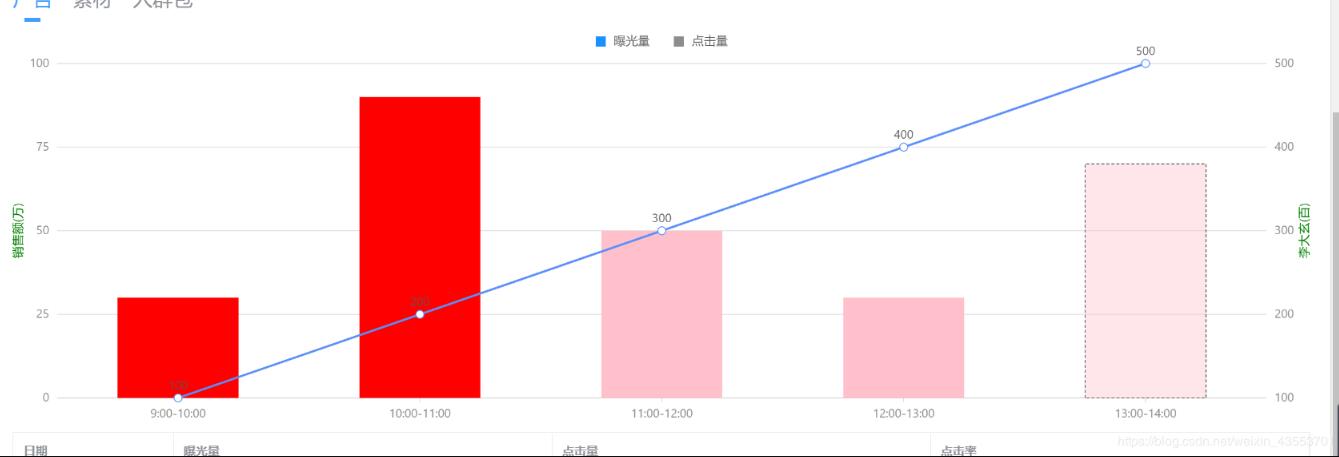
 { time: '9:00-10:00', value: 30 , type: '曝光量', rate: 100 },
   { time: '10:00-11:00', value: 90, type: '曝光量', rate: 200 },
   { time: '11:00-12:00', value: 50, type: '點擊量', rate: 300 },
   { time: '12:00-13:00', value: 30, type: '點擊量', rate: 400 },
   { time: '13:00-14:00', value: 70, type: '點擊量', rate: 500 }
],<template> <div class="page"> <div :id="id"></div> </div> </template>
<script type="text/ecmascript-6">
import { Chart } from '@antv/g2';
export default {
  name: 'Name', // Pascal命名
  components: {},
  props: {
    id: {
      type: String,
      default: 'chart'
    },
    height: {
      type: Number,
      default: 500
    },
    chartWidth: {
      type: Number,
    },
    chartData: {
      type: Array,
      default: () => {}
    },
  },
  data() {
    return {};
  },
  computed: {},
  watch: {},
  filters: {},
  beforeCreate() {},
  created() {},
  mounted() {
    this.initPage();
  },
  methods: {
    initPage() {},
    drawChart() {
      const _this = this;
      const chart = new Chart({
        container: _this.id,
        autoFit: true,
        height: _this.height,
        width: _this.chartWidth
      });
      chart.data(_this.chartData);
      chart.scale({
        value: {
          alias: '銷售額(萬)',
          nice: true,
        },
        rate: {
          alias: '李大玄(百)',
          nice: true,
        },
      });
      chart.axis('rate', {
        title: {
          top: '0',
          style: {
            fill: 'green',
          },
        },
      });
      chart.axis('value', {
        title: {
          top: '0',
          style: {
            fill: 'green',
          },
        },
      });

      chart.tooltip({
        showCrosshairs: true, // 展示 Tooltip 輔助線
        showMarkers: false,
        shared: true,
      });
      chart.interaction('element-active');
      chart.legend({
        position: 'top',
        items: [
          { name: '曝光量', value: '曝光量', marker: { symbol: 'square', style: { fill: '#1890FF', r: 5 } } },
          { name: '點擊量', value: '點擊量', marker: { symbol: 'square', style: { fill: '#8c8c8c', r: 5 } } },
        ],
      });

      chart
        .interval()
        .adjust('stack')
        .color('type', ['red', 'pink'])
        .position('time*value')
        .style('time', val => {
          if (val === '13:00-14:00') {
            return {
              fillOpacity: 0.4,
              lineWidth: 1,
              stroke: '#636363',
              lineDash: [3, 2]
            };
          }
          return {
            fillOpacity: 1,
            lineWidth: 0,
            stroke: '#636363',
            lineDash: [100, 0.5]
          };
        });
      chart.line().position('time*rate').label('rate');
      chart.point().position('time*rate');
      // chart.interval().position('genre*sold');
      // chart.intervalDodge().position('date*value').color('type');
      chart.render();
    }
  },
};
</script>
<style lang="scss" scoped> </style>
讀到這里,這篇“vue+antv怎么實現折線圖”文章已經介紹完畢,想要掌握這篇文章的知識點還需要大家自己動手實踐使用過才能領會,如果想了解更多相關內容的文章,歡迎關注億速云行業資訊頻道。
免責聲明:本站發布的內容(圖片、視頻和文字)以原創、轉載和分享為主,文章觀點不代表本網站立場,如果涉及侵權請聯系站長郵箱:is@yisu.com進行舉報,并提供相關證據,一經查實,將立刻刪除涉嫌侵權內容。