您好,登錄后才能下訂單哦!
您好,登錄后才能下訂單哦!
這篇文章將為大家詳細講解有關如何用R語言ggforce包畫餅狀圖,文章內容質量較高,因此小編分享給大家做個參考,希望大家閱讀完這篇文章后對相關知識有一定的了解。
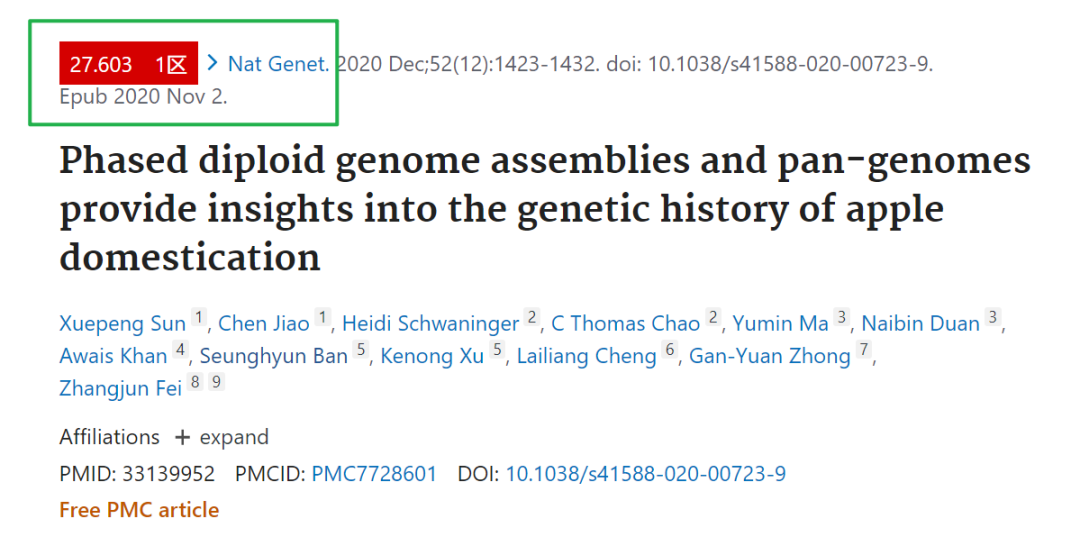
最近在看論文 Phased diploid genome assemblies and pan-genomes provide insights into the genetic history of apple domestication 今天的筆記記錄的是論文中Figure2圖b中的餅圖的畫法
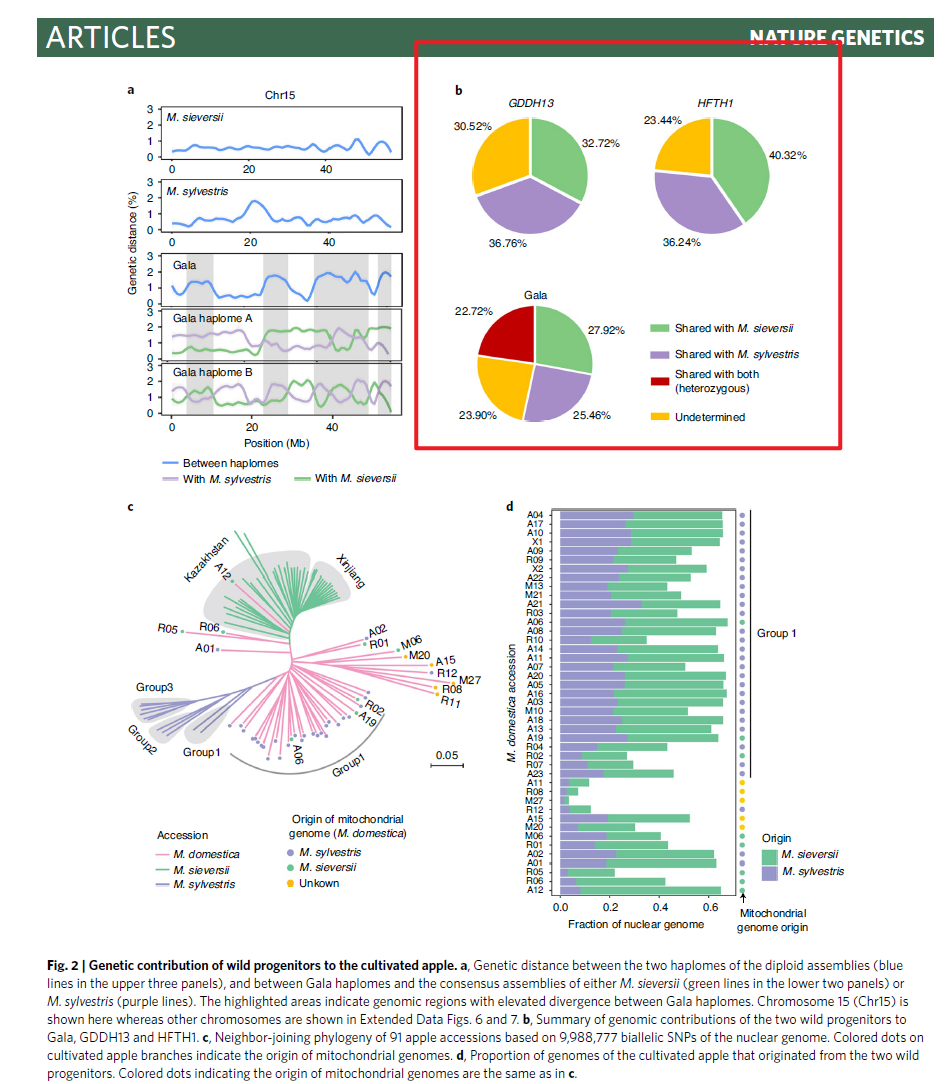
ggplot2畫拼圖我個人認為相對是比較麻煩的,而且要實現上圖這種各個部分能夠分開的好像不太好實現。之前找餅狀圖的資料的時候發現了
ggforce這個包,用他來做餅圖相對方便很多,今天的內容主要用這個包里的函數來實現
數據只需要兩列就可以了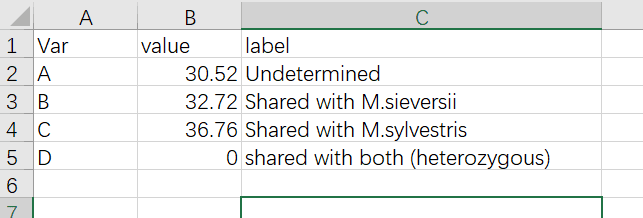
install.packages("ggforce")
df1<-read.csv("pieplot/AA.csv",header = T)
df1
ggplot()+
  geom_arc_bar(data=df1,
               stat = "pie",
               aes(x0=0,y0=0,r0=0,r=2,
                   amount=value,fill=Var,
                   explode=c(0.05,0.05,0.05,0)),
               )
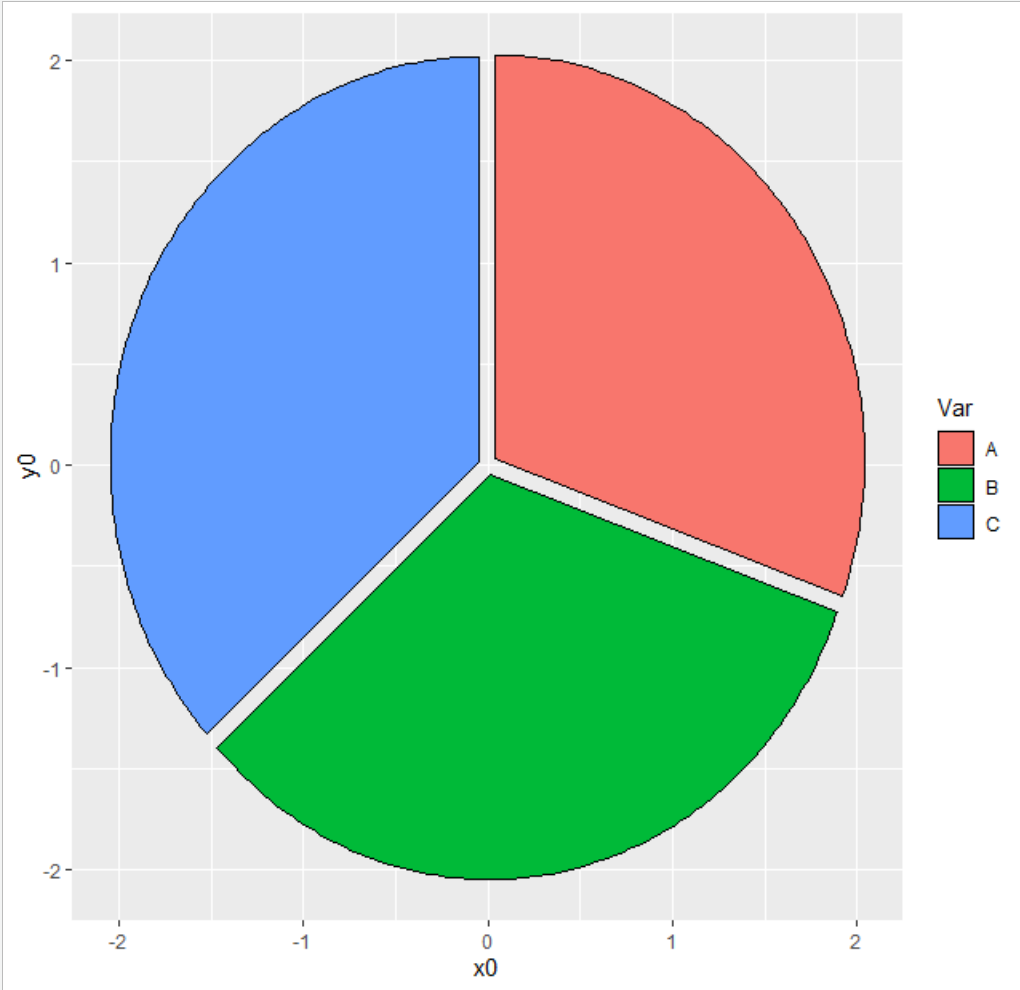
關鍵還可以把中間給弄成空心的
ggplot()+
  geom_arc_bar(data=df1,
               stat = "pie",
               aes(x0=0,y0=0,r0=1,r=2,
                   amount=value,fill=Var,
                   explode=c(0.05,0.05,0.05,0)),
               )
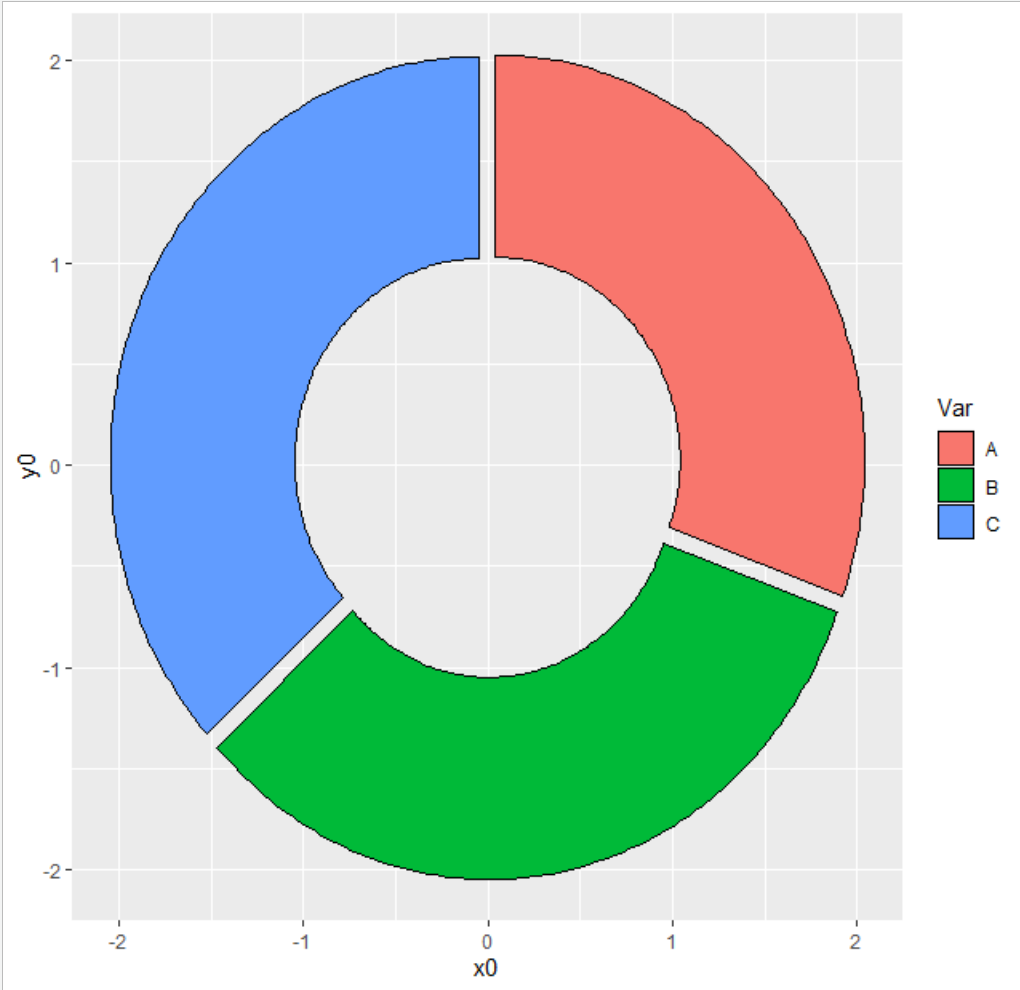
做餅狀圖用到的函數是
geom_arc_bar(),這個函數里參數的作用之前錄制過視頻大家可以參考一下
library(ggforce)
df1<-read.csv("pieplot/AA.csv",header = T)
df1
df2<-edit(df1)
p1<-ggplot()+
  geom_arc_bar(data=df1,
               stat = "pie",
               aes(x0=0,y0=0,r0=0,r=2,
                   amount=value,fill=Var,
                   explode=c(0.05,0.05,0.05,0)),
               )+
  scale_fill_manual(values = c("#80c97f","#a68dc8",
                               "#ffc000","#c00000"))+
  annotate("text",x=0,y=-2.2,label="32.72%")+
  annotate("text",x=-1.6,y=1.5,label="36.76%",angle=50)+
  annotate("text",x=1.6,y=1.5,label="30.52%",angle=-50)+
  theme_void()+
  theme(legend.position = "none",
        plot.title = element_text(hjust = 0.5,face="italic"))+
  labs(title = "GDDH13")
p2<-ggplot()+
  geom_arc_bar(data=df1,
               stat = "pie",
               aes(x0=0,y0=0,r0=0,r=2,
                   amount=value,fill=Var,
                   explode=c(0.05,0.05,0.05,0)),
  )+
  scale_fill_manual(values = c("#80c97f","#a68dc8",
                               "#ffc000","#c00000"))+
  annotate("text",x=0,y=-2.2,label="32.72%")+
  annotate("text",x=-1.6,y=1.5,label="36.76%",angle=50)+
  annotate("text",x=1.6,y=1.5,label="30.52%",angle=-50)+
  theme_void()+
  theme(legend.position = "none",
        plot.title = element_text(hjust = 0.5,face="italic"))+
  labs(title = "GDDH13")
p3<-ggplot()+
  geom_arc_bar(data=df2,
               stat = "pie",
               aes(x0=0,y0=0,r0=0,r=2,
                   amount=value,fill=Var,
                   explode=c(0.05,0.05,0.05,0.05)),
  )+
  scale_fill_manual(values = c("#80c97f","#a68dc8",
                               "#ffc000","#c00000"))+
  annotate("text",x=0.5,y=-2.2,label="32.72%")+
  annotate("text",x=-1.6,y=1.5,label="16.76%",angle=50)+
  annotate("text",x=-2.2,y=0.5,label="30%",angle=80)+
  annotate("text",x=1.6,y=1.5,label="30.52%",angle=-50)+
  theme_void()+
  theme(legend.position = "none",
        plot.title = element_text(hjust = 0.5,face="italic"))+
  labs(title = "GDDH13")
p3
library(cowplot)
plot_grid(p1,p2,p3,ncol = 2,nrow=2)

這樣是沒有圖例的,我想到的辦法是重新做一個圖,拼接到右下角作為圖例
df4<-data.frame(x=1,y=c(1,2,3,4),label=c("A","B","C","D"))
p4<-ggplot(df4,aes(x=x,y=y))+
  geom_text(aes(x=x+0.2,y=y,label=label))+
  geom_point(aes(color=label),show.legend = F,size=4)+
  theme_void()+
  ylim(-8,8)+xlim(-1,3)+
  scale_color_manual(values = c("#80c97f","#a68dc8",
                               "#ffc000","#c00000"))
plot_grid(p1,p2,p3,p4,ncol = 2,nrow=2)
最終的效果如下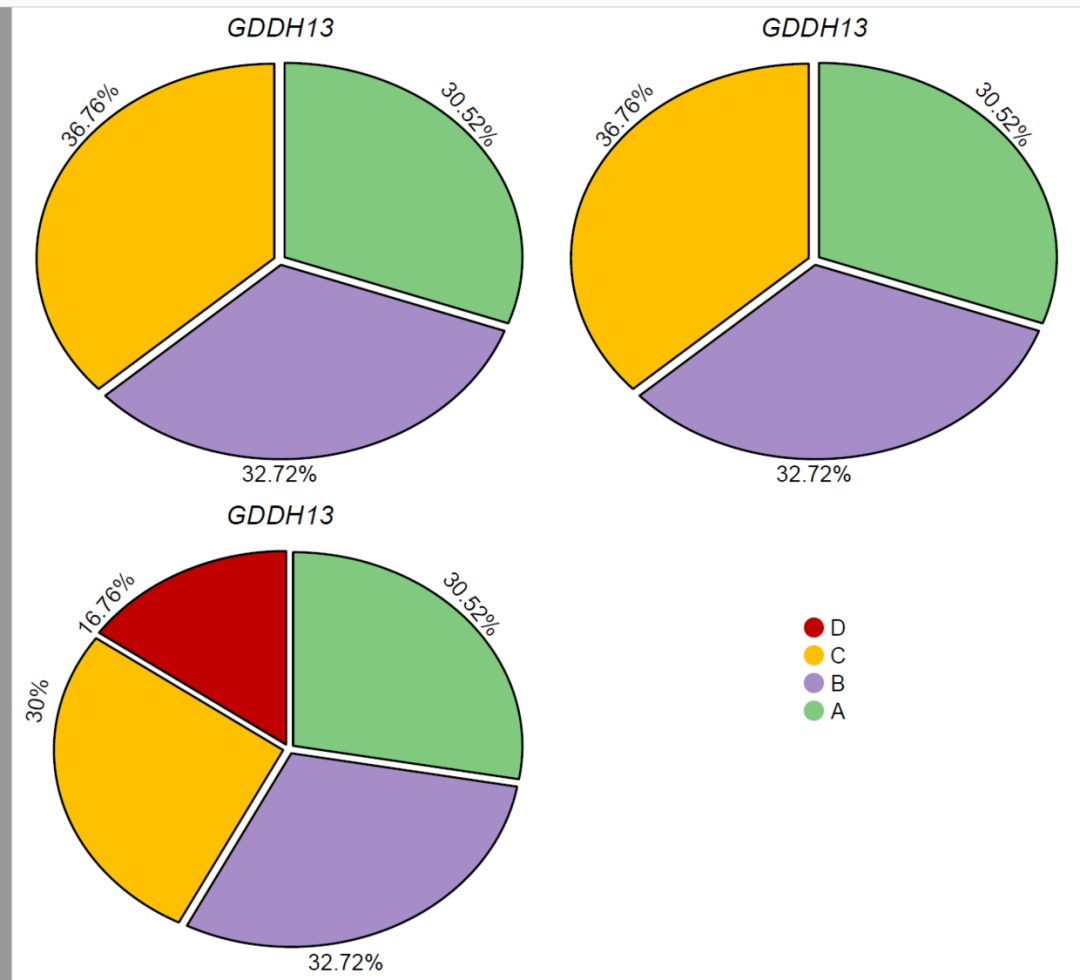
關于如何用R語言ggforce包畫餅狀圖就分享到這里了,希望以上內容可以對大家有一定的幫助,可以學到更多知識。如果覺得文章不錯,可以把它分享出去讓更多的人看到。
免責聲明:本站發布的內容(圖片、視頻和文字)以原創、轉載和分享為主,文章觀點不代表本網站立場,如果涉及侵權請聯系站長郵箱:is@yisu.com進行舉報,并提供相關證據,一經查實,將立刻刪除涉嫌侵權內容。