溫馨提示×
您好,登錄后才能下訂單哦!
點擊 登錄注冊 即表示同意《億速云用戶服務條款》
您好,登錄后才能下訂單哦!
使用Python怎么實現一個坐標線性插值應用?相信很多沒有經驗的人對此束手無策,為此本文總結了問題出現的原因和解決方法,通過這篇文章希望你能解決這個問題。
一、背景
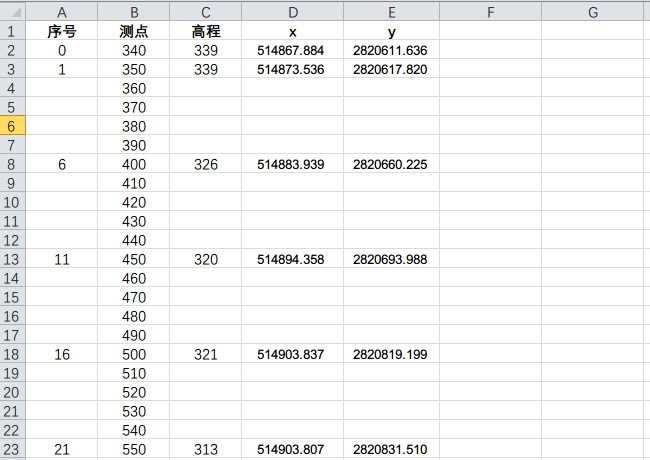
在野外布設700米的測線,點距為10米,用GPS每隔50米測量一個坐標,再把測線的頭和為測量一個坐標。現在需使用線性插值的方法求取每兩個坐標之間的其他4個點的值。

二、插值原理
使用等比插值的方法
起始值為 a
終止值為 b
步長值為 (a-b)/5
后面的數分別為 a+n, a+2n, a+3n, a+4n
三、代碼實習對 x 插值
interx.py
import numpy as np
f = np.loadtxt('datax.txt')
a = f[:, 0]
b = f[:, 1]
for j in np.arange(len(a)):
	aa = a[j]*1000	# np.arrange()會自動去掉小數
	bb = b[j]*1000
	n = (bb-aa) / 5
	x = np.arange(6)
	x[0] = aa
	print(x[0]/1000)
	for i in range(1, 5, 1):
		x[i] = x[i-1]+n
		print(x[i]/1000)
		i = i+1
	# print(bb/1000)
	# print("\n")
datax.txt
514873.536 	514883.939
514883.939 	514894.358
514894.358 	514903.837
514903.837 	514903.807
514903.807 	514907.179
514907.179 	514911.356
514911.356 	514913.448
514913.448 	514913.315
514913.315 	514917.344
514917.344 	514923.684
514923.684 	514924.801
514924.801	514929.697
514929.697 	514916.274
對 y 插值
intery.py
import numpy as np
f = np.loadtxt('datay.txt')
a = f[:, 0]
b = f[:, 1]
for j in np.arange(len(a)):
	aa = (a[j] - 2820000)*1000	# 數據太長會溢出
	bb = (b[j]-2820000)*1000
	n = (bb-aa) / 5
	x = np.arange(6)
	x[0] = aa
	print(x[0]/1000+2820000)
	for i in range(1, 5, 1):
		x[i] = x[i-1]+n
		print(x[i]/1000+2820000)
		i = i+1
	# print(bb/1000)
	# print("\n")
datay.txt
2820617.820 	2820660.225
2820660.225 	2820693.988
2820693.988 	2820819.199
2820819.199 	2820831.510
2820831.510 	2820858.666
2820858.666 	2820973.487
2820973.487 	2821017.243
2821017.243 	2821019.518
2821019.518 	2821058.223
2821058.223 	2821097.575
2821097.575 	2821144.436
2821144.436 	2821173.356
2821173.356 	2821218.889
四、最終成果
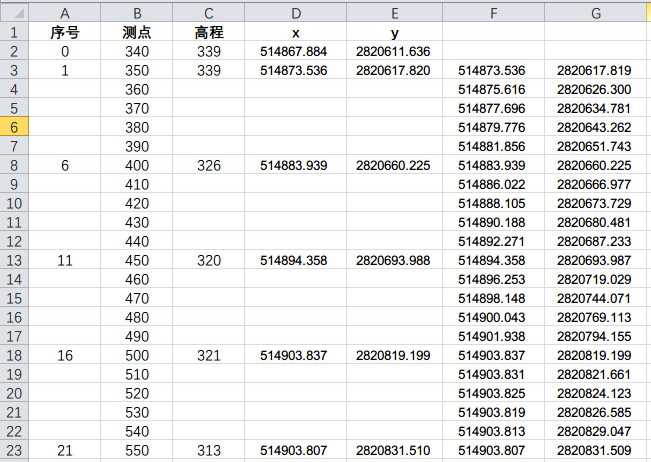
手動把兩次插值結果復制到dataxy中
dataxy.txt
514873.536 	2820617.819
514875.616 	2820626.300
514877.696 	2820634.781
514879.776 	2820643.262
514881.856 	2820651.743
514883.939 	2820660.225
514886.022 	2820666.977
514888.105 	2820673.729
514890.188 	2820680.481
514892.271 	2820687.233
514894.358 	2820693.987
514896.253 	2820719.029
514898.148 	2820744.071
514900.043 	2820769.113
514901.938 	2820794.155
514903.837 	2820819.199
514903.831 	2820821.661
514903.825 	2820824.123
514903.819 	2820826.585
514903.813 	2820829.047
514903.807 	2820831.509
514904.481 	2820836.940
514905.155 	2820842.371
514905.829 	2820847.802
514906.503 	2820853.233
514907.179 	2820858.666
514908.014 	2820881.630
514908.849 	2820904.594
514909.684 	2820927.558
514910.519 	2820950.522
514911.356 	2820973.487
514911.774 	2820982.238
514912.192 	2820990.989
514912.610 	2820999.740
514913.028 	2821008.491
514913.448 	2821017.242
514913.421 	2821017.697
514913.394 	2821018.152
514913.367 	2821018.607
514913.340 	2821019.062
514913.315 	2821019.518
514914.120 	2821027.259
514914.925 	2821035.000
514915.730 	2821042.741
514916.535 	2821050.482
514917.344 	2821058.223
514918.612 	2821066.093
514919.880 	2821073.963
514921.148 	2821081.833
514922.416 	2821089.703
514923.684 	2821097.575
514923.907 	2821106.947
514924.130 	2821116.319
514924.353 	2821125.691
514924.576 	2821135.063
514924.801 	2821144.436
514925.780 	2821150.219
514926.759 	2821156.002
514927.738 	2821161.785
514928.717 	2821167.568
514929.697 	2821173.356
514927.012 	2821182.462
514924.327 	2821191.568
514921.642 	2821200.674
514918.957 	2821209.780

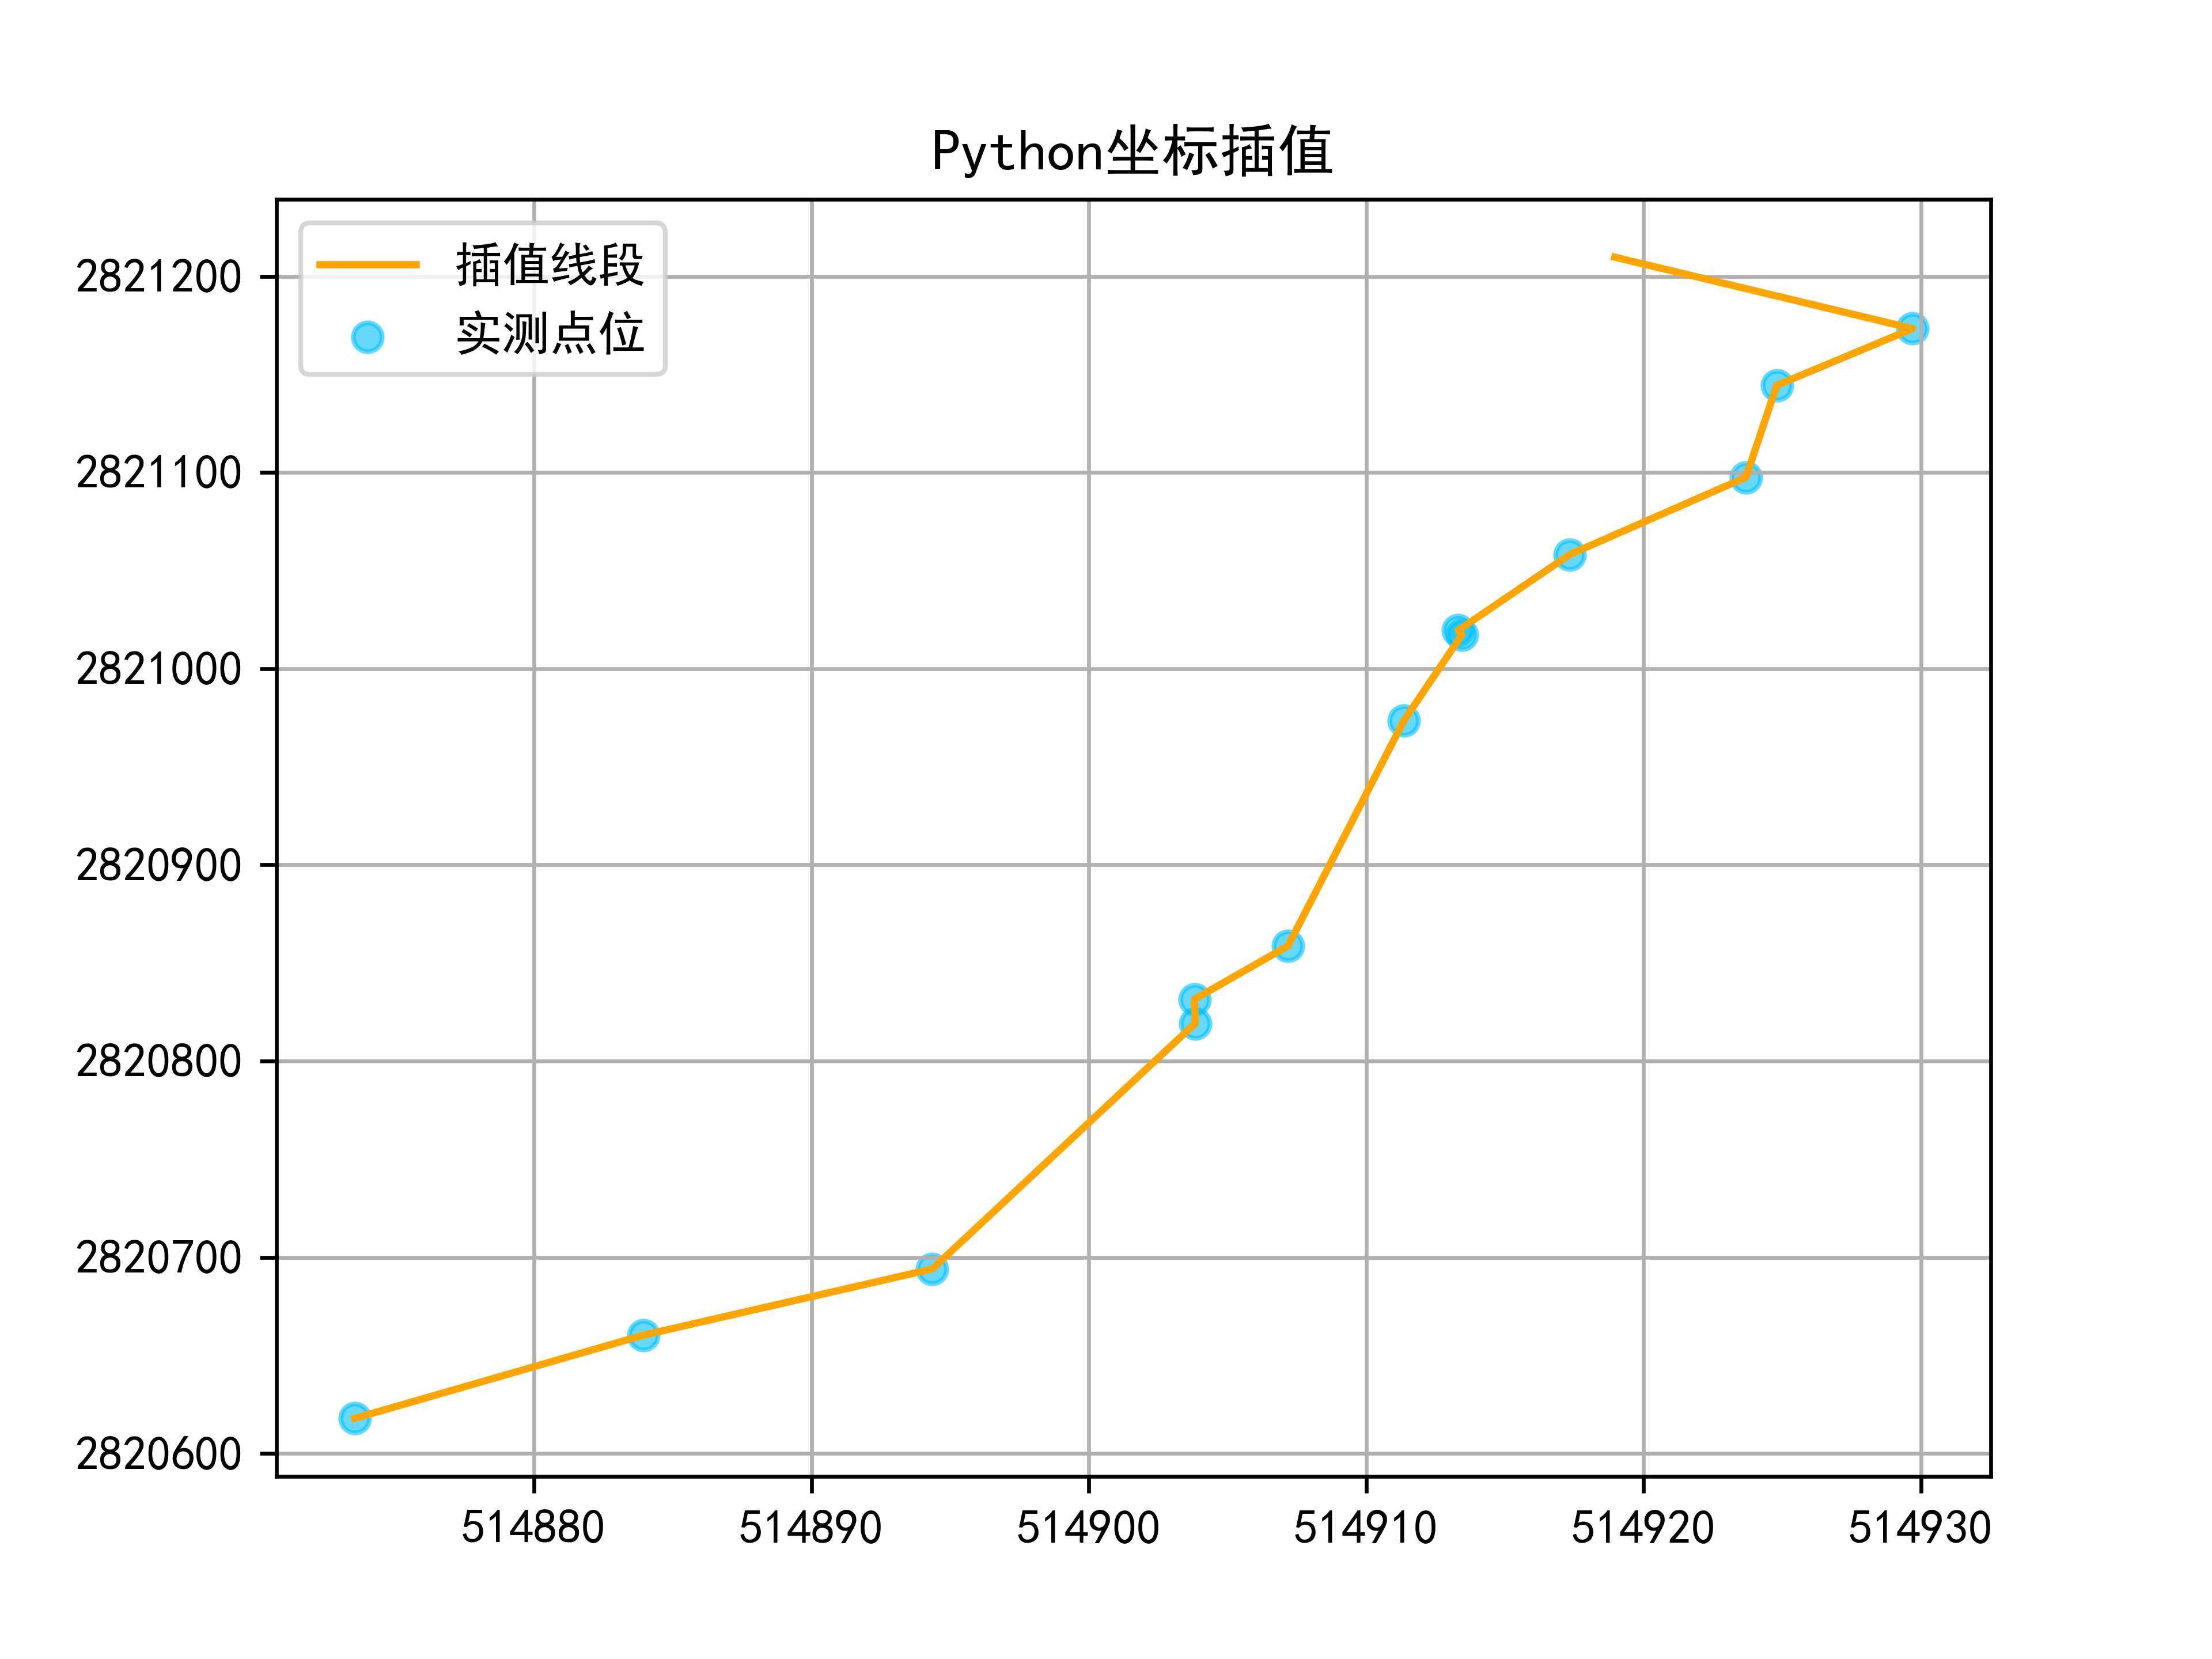
五、畫圖對比
dataxy.py
import numpy as np
import matplotlib as mpl
from matplotlib import pyplot as plt
# 解決中文字體顯示不出來
mpl.rcParams["font.sans-serif"]=["SimHei"]
mpl.rcParams["axes.unicode_minus"] = False

a = np.loadtxt("datax.txt")
b = np.loadtxt('datay.txt')
c = np.loadtxt('dataxy.txt')
x = a[: ,0]
y = b[: ,0]
xx = c[:,0]
yy = c[:,1]
plt.plot(x,y,color = 'orange',
		label = '插值線段')
plt.scatter(xx,yy,marker='o',
	c = 'deepskyblue',
	alpha = 0.6,
	label = '實測點位')
plt.legend()
plt.title('Python坐標插值')
plt.grid()
# 保存高清圖片,dpi表示分辨率
plt.savefig('out.png',dpi = 600)
plt.show()
文件結構

看完上述內容,你們掌握使用Python怎么實現一個坐標線性插值應用的方法了嗎?如果還想學到更多技能或想了解更多相關內容,歡迎關注億速云行業資訊頻道,感謝各位的閱讀!
免責聲明:本站發布的內容(圖片、視頻和文字)以原創、轉載和分享為主,文章觀點不代表本網站立場,如果涉及侵權請聯系站長郵箱:is@yisu.com進行舉報,并提供相關證據,一經查實,將立刻刪除涉嫌侵權內容。