溫馨提示×
您好,登錄后才能下訂單哦!
點擊 登錄注冊 即表示同意《億速云用戶服務條款》
您好,登錄后才能下訂單哦!
這篇文章給大家分享的是有關Python如何爬取杭州24時溫度并展示的內容。小編覺得挺實用的,因此分享給大家做個參考,一起跟隨小編過來看看吧。
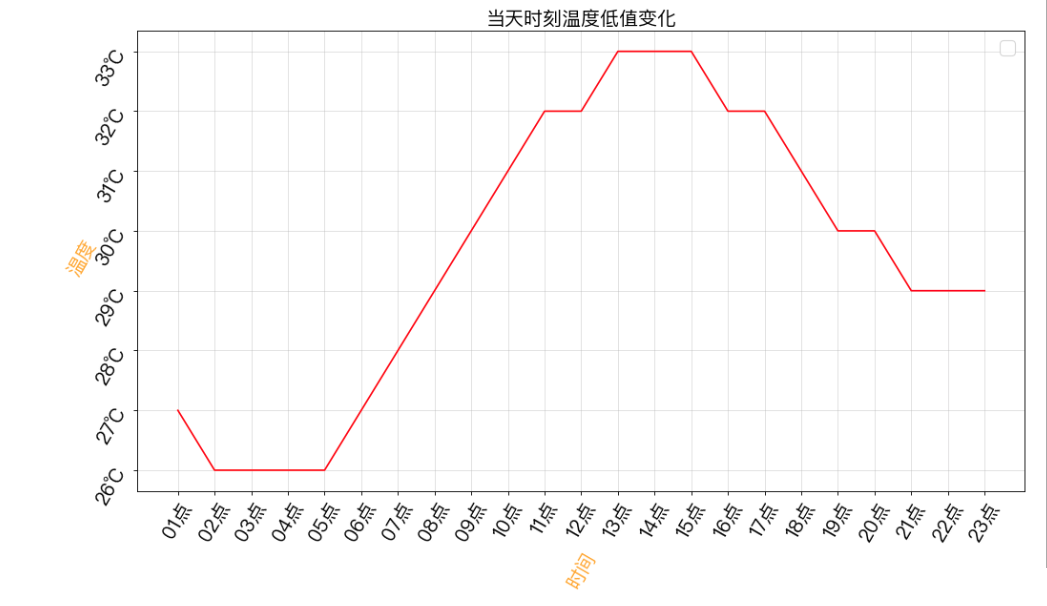
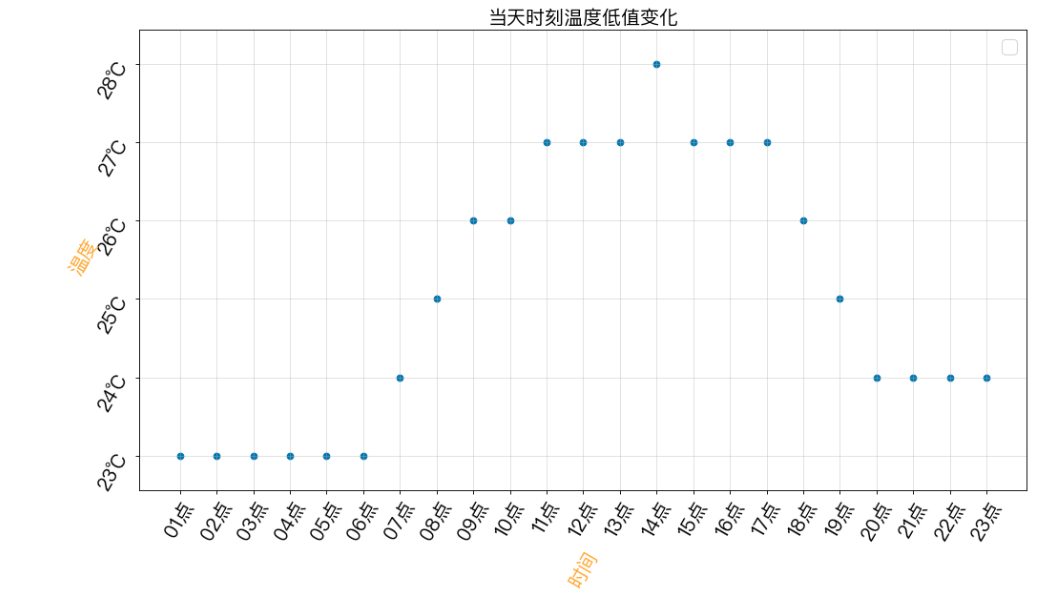
散點圖 爬蟲杭州今日24時溫度 https://www.baidutianqi.com/today/58457.htm
利用正則表達式爬取杭州溫度
面向對象編程
圖表展示(散點圖 / 折線圖)
導入相關庫
import requests
import re
from matplotlib import pyplot as plt
from matplotlib import font_manager
import matplotlib
類代碼部分
class Weather(object):
  def __init__(self):
    self.url = 'https://www.baidutianqi.com/today/58457.htm'
    self.headers = {'user-agent': 'Mozilla/5.0 (Windows NT 10.0; Win64; x64) AppleWebKit/537.36 (KHTML, like Gecko) Chrome/73.0.3683.75 Safari/537.36'}
  #請求
  def __to_requests(self):
    response = requests.get(url=self.url,headers=self.headers)
    return self.__to_paeser(response.content.decode('utf-8'))
  #解析
  def __to_paeser(self,html):
    #正則表達式 要從數據循環的部分寫起 如果從循環的父標簽開始 , 則只會匹配到一個值 即父標簽下的某個標簽 , 而不是循環下的
    pattern = re.compile('<li>.*?<font class="red">(.*?)</font>.*?<font class="blue">(.*?)</font></li>',re.S)
    return re.findall(pattern,html)

  #展示
  def __to_show(self,data):
    x = []
    y = []
    for value in data:
      x.append(value[0])
      y.append(int(value[1][-2:]))
    #畫布
    plt.figure(figsize=(15,8),dpi=80)
    #中文 /System/Library/Fonts/PingFang.ttc   C:\Windows\Fonts\simsun.ttc
    my_font = font_manager.FontProperties(fname='/System/Library/Fonts/PingFang.ttc',size=18)
    #x y 軸刻度 標簽 區分 y的刻度值/刻度標簽 和 y本身的值
    plt.xticks(fontproperties=my_font,rotation=60)
    y_ticks = ["{}℃".format(i) for i in range(min(y),max(y)+1)]
    plt.yticks(range(min(y),max(y)+1),y_ticks,fontproperties=my_font,rotation=60)
    # x y 軸說明
    plt.xlabel('時間',color='orange',rotation=60,fontproperties=my_font)
    plt.ylabel('溫度',color='orange',rotation=60,fontproperties=my_font)
    #網格
    plt.grid(alpha=0.4)
    #標題
    plt.title('當天時刻溫度低值變化',fontproperties=my_font)
    #圖例
    plt.legend(prop=my_font)
    #作畫
#     plt.scatter(x,y,label='2019-08-22')
    plt.plot(x,y,color='red')
    plt.show()
  #操作
  def to_run(self):
    result = self.__to_requests()
    self.__to_show(result)
調用并展示
if __name__ == '__main__':
  wt = Weather()
  wt.to_run()


感謝各位的閱讀!關于“Python如何爬取杭州24時溫度并展示”這篇文章就分享到這里了,希望以上內容可以對大家有一定的幫助,讓大家可以學到更多知識,如果覺得文章不錯,可以把它分享出去讓更多的人看到吧!
免責聲明:本站發布的內容(圖片、視頻和文字)以原創、轉載和分享為主,文章觀點不代表本網站立場,如果涉及侵權請聯系站長郵箱:is@yisu.com進行舉報,并提供相關證據,一經查實,將立刻刪除涉嫌侵權內容。